
Analyst
Bernstein Analysts Revise Bitcoin Target, $200,000 And $1 Million Become Main Focus

Bernstein analysts Gautam Chhugani and Mahika Sapra recently revised their price targets for Bitcoin in their latest market report, which also initiated coverage on MicroStrategy. These analysts also outlined factors that they believe could contribute to BTC’s exponential price surge.
Bitcoin To Hit $200,000 And Then $1 Million
Chhugani and Sapra predicted in the report that BTC will rise to a cycle high of $200,000 by 2025 and that the flagship crypto will reach $1 million by 2033. Bernstein had previously predicted that Bitcoin would reach $150,000 by 2025. However, these analysts have now revised their targets and alluded to the institutional demand for BTC as one of the reasons they believe the flagship crypto can reach such heights.
Related Reading
The research firm predicts that the Spot Bitcoin ETFs will continue to record impressive demand and that the Bitcoin under management could reach $190 billion by 2025, a significant increase from the $60 billion in BTC that funds issuers already have under management.
In other words, these analysts expect BTC’s price to succumb to the supply and demand dynamics, considering that the Bitcoin in circulation is bound to drastically reduce as these Spot Bitcoin ETFs continue to accumulate a significant amount of the crypto token for their respective ETFs. Moreover, two Bitcoin halvings are set to occur before 2033, further reducing miners’ supply and thereby supporting their base case of BTC hitting $1 million.
MicroStrategy To Benefit From BTC’s Growth
These Berstein analysts also initiated coverage on MicroStrategy with an outperform rating. They predict that the software company’s stock can rise to $2,890 thanks to its BTC exposure. A rise to $2,890 represents about a 95% increase for MicroStrategy’s stock, which is currently valued at around $1,500.
The research firm noted that MicroStrategy has committed itself to “building the world’s largest Bitcoin company.” This has already paid off so far, with Chhugani and Sapra stating that the software company has transformed from a “small software company to the largest BTC holding company” since August 2020 (when it started accumulating BTC).
MicroStrategy already owns 1.1% of Bitcoin’s total supply, with holdings worth around $14.5 billion. The company’s BTC holdings are expected to increase soon enough, as they recently announced plans to offer $500 million of Convertible Senior Notes. Some of the proceeds from the proposed sale will be used to buy additional BTC.
Related Reading
Berstein highlighted how the company’s co-founder Michael Saylor has become synonymous with the Bitcoin brand and that the company’s position as the leading Bitcoin company has helped attract “at scale capital (both debt and equity) for an active Bitcoin acquisition strategy.” In dollar terms, Bernstein noted that MicroStrategy’s Bitcoin net asset value (NAV) per share “has grown nearly fourfold, surpassing the 2.4x growth in Bitcoin’s spot price.”
“We believe MSTR’s long term convertible debt strategy allows it enough time to gain from Bitcoin upside, with limited liquidation risk to its Bitcoin on balance sheet.” Chhugani and Sapra added.
Featured image created with Dall.E, chart from Tradingview.com
Source link


Crypto analyst TechDev has provided insights into the Bitcoin future trajectory. The analyst suggested that the flagship crypto has yet to reach its full potential in this market cycle and that more price surges lie ahead for the crypto token.
Not Yet Time For A Bitcoin Blowoff Top
TechDev remarked in an X (formerly Twitter) post that the Bitcoin blowoff tops only happen after the four-week Chaikin money flow (CMF) breaks a line he highlighted on the accompanying chart. His analysis suggests that Bitcoin is still bound to make a parabolic move to the upside before it experiences a significant decline.
Related Reading
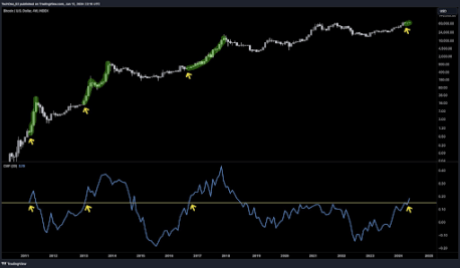
Blowoff tops are a chart pattern that shows the rapid increase in an asset’s price followed by a sharp drop in its price. TechDev’s chart showed that something similar happened in the previous bull cycles, with Bitcoin enjoying a parabolic uptrend for about a year before its price dropped sharply.
Similarly, based on TechDev’s chart, Bitcoin is again set to enjoy a parabolic uptrend from now to sometime in 2025 before it reaches its market top and begins to decline significantly. In another X post, the analyst suggested that the time has almost for Bitcoin to enjoy its next leg up. As crypto analyst Rekt Capital claimed, this next move to the upside will take Bitcoin into the ‘parabolic uptrend’ phase of this market cycle.
Interestingly, this breakout for Bitcoin could happen sooner than expected, with TechDev claiming that in 18 days, Bitcoin will have a chance at a breakout that it has only seen once in its entire history. From a chart he shared, TechDev hinted at Bitcoin rising to as high as $190,000 in this bull run.
It is also worth mentioning that crypto analyst CrediBULL Crypto recently predicted that a Bitcoin breakout is imminent. He said Bitcoin would “absolutely giga send” in seven to ten days and rise to as high as $100,000 when this move happens.
Bitcoin’s Breakout May Still Take A While
Crypto analyst Rekt Capital recently stated that Bitcoin’s breakout from this Re-Accumulation range would occur in September 2024 if history repeats itself. The crypto analyst claimed that Bitcoin’s struggle to break out from this Re-Accumulation range is “beneficial for the overall cycle.”
Related Reading
He noted that Bitcoin has never broken out this early in the post-halving period. Rekt Capital remarked that a Bitcoin breakout this early means that this cycle would be accelerated and that the bull market would be shorter than usual. As such, he believes that this lengthy consolidation is helping Bitcoin’s price resynchronize with historical halving cycles so that the market can experience a “normal and usual bull run.”
At the time of writing, Bitcoin is trading at around $66,900, down almost 1% in the last 24 hours, according to data from CoinMarketCap.
Featured image created with Dall.E, chart from Tradingview.com
Source link

Dogecoin (DOGE) is again in the spotlight as the foremost meme coin could be ready for takeoff. This follows crypto analyst Kevin’s (formerly Yomi OG) analysis of Dogecoin, in which he highlighted an important indicator that has turned bullish for the crypto token.
Dogecoin Indicator Turns Green For The First Since 2020
Kevin mentioned in an X (formerly Twitter) post that the 12-day time frame on the Gaussian channel just recently flipped green on Dogecoin’s chart for the first time since December 2020. He claimed that this indicates a “potential strong bullish trend” is on the cards for the meme coin in the coming months.
Related Reading
Kevin added that this indicator has never failed in indicating these trend changes, suggesting that Dogecoin has indeed undergone a bullish reversal.
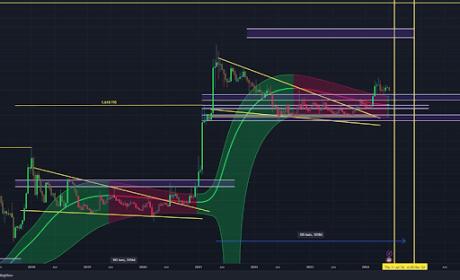
In another X post, Kevin claimed that Dogecoin has looked much stronger than most altcoins throughout this period, during which the crypto market has continued to bleed and trade sideways. He added that Dogecoin will likely move into the golden pocket at the $0.26 to $0.33 range if it can stay above the Macro 0.382 FIB and the blue support zone on the weekly time frame.
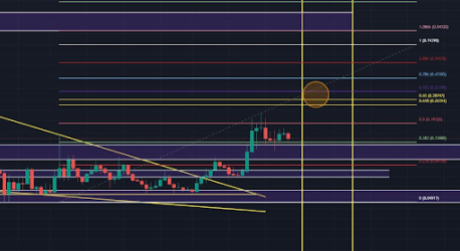
Kevin also provided another bullish narrative for Dogecoin in another X post. Looking at the four-hour time frame chart, he highlighted a deviation back into the larger symmetrical triangle, which he claimed is a “bullish sign.” He stated that Dogecoin getting back above key moving averages will be important. He also added that he expects the foremost meme coin to test the $0.175 price level at some point, as there is a lot of liquidity in that price range.
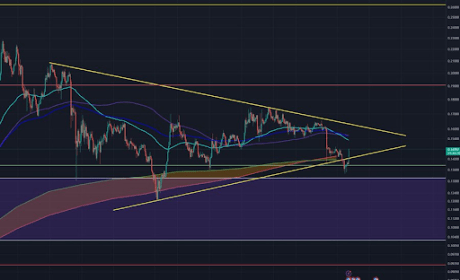
The crypto analyst also hammered on liquidity at that price area. He claimed there is a “very big block of liquidity” at the $0.175 level, looking at the 3-month time frame. Additionally, he said that most of the liquidity beyond that level is between the $0.20 to $0.23 range. This is bullish for Dogecoin, as Kevin noted that market makers like to move where the liquidity is, and it is definitely higher for Dogecoin at the moment.
DOGE’s Next Move
Crypto analyst CrediBULL Crypto recently mentioned that Dogecoin has reached a ‘make it or break it’ level. He, however, seemed confident that Dogecoin could experience an upward trend from its current price level, noting that the meme coin had reached this ‘make it or break it’ level when Bitcoin hit its range lows. As such, he expects Dogecoin to enjoy a price rebound if the flagship crypto experiences a bullish reversal.
Related Reading
Meanwhile, crypto analyst Crypto Daily has made a short-term bullish forecast for DOGE. He predicted that Dogecoin would rise to between $0.33 and $0.35 soon. The analyst added that a daily close above $0.18308 could lead to further gains up to $0.57 for Dogecoin.
Source link

Major crypto analysts have weighed in on the Bitcoin future trajectory, especially as the flagship crypto has maintained a tepid price action and has continued to consolidate since the halving took place. These analysts predict that Bitcoin will soon rise and climb to a six-digit all-time high (ATH).
Bitcoin To Rise To $100,000
Crypto analyst CrediBULL Crypto predicted in an X (formerly Twitter) post that Bitcoin would rise to $100,000 on its next leg up. He claimed that this upward trend would begin in the next seven to ten days, stating that BTC will “absolutely giga send” when that time comes. The analyst made these remarks while suggesting that the worst was over for Bitcoin.
Related Reading
He alluded to the “brutal” price correction that Bitcoin underwent shortly before and after the halving, with the flagship crypto experiencing a 20% price drop. As such, he believes that BTC is unlikely to decline that much again from its current price level.
Instead, CrediBULL Crypto claimed that the downside is now limited to $60,000 and that, realistically, Bitcoin can’t drop below $62,000 and $63,000. Whatever happens, he expects the Bitcoin pump to begin in the next ten days, which would send it to $100,000.
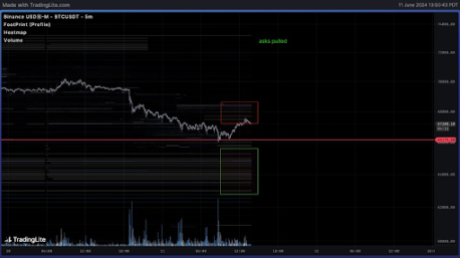
In another X post, CrediBULL Crypto stated that things were looking good for Bitcoin. He suggested that the bears would get shaken out of their positions once Bitcoin clears the asks that are above its current price level. He also noted that Bitcoin’s open interest is dropping a bit because the short positions are already starting to cover, and the spot premium is returning for the first time since May 20th.
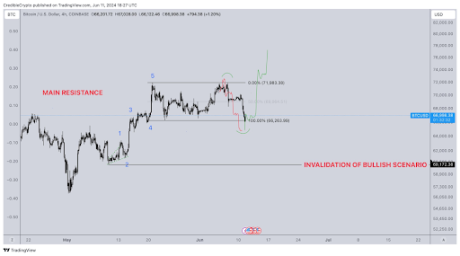
Interestingly, CrediBULL had earlier predicted that Bitcoin would experience a price decline to $66,000. He had made this prediction as part of a bigger picture, which would send BTC’s price rallying above $71,000 following the price correction. Seeing as the drop to $66,000 has occurred, CrediBULL suggested that it was time for the upward trend to begin.
BitcBTCoin Still Headed For $173,000
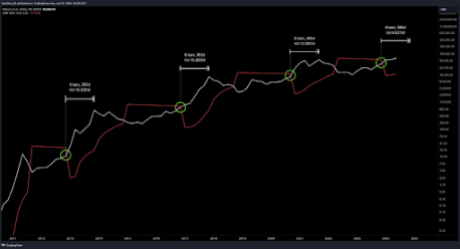
Crypto analyst Egrag Crypto has given a more bullish price for prediction, stating that the next target for the flagship crypto is $173,000. He made this assertion while noting that Bitcoin’s current price action is currently mirroring its price action in the 2017 market cycle, consolidating around Fib 1.0 just like it did back then.
Related Reading
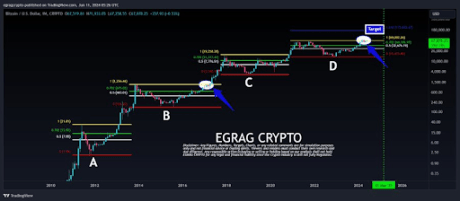
He highlighted that Bitcoin had four monthly candles followed by an “explosive fifth one” back in 2017. According to Egrag, the same thing is happening again, with Bitcoin already showing four monthly candles while consolidating around its previous ATH. As such, he believes the explosive fifth candle will come in July, just like in 2017.
Featured image created with Dall.E, chart from Tradingview.com
Source link

Anonymous Donor Pays $500,000 in Bitcoin for Julian Assange's Freedom Flight

BTC Hashrate decline spurs interest in altcoins: APORK, RNDR, APT emerge

Cardano Price Expected To Hit $40 Next Per Crypto Analysts

Web3 Game Con: The World’s Largest Web3 Game Show Debuts at ABS2024 in Taipei

German Government Moves Millions in Bitcoin to Exchanges

Notcoin surges 10% amid token burn and $4.2m incentive plan

Robert Kiyosaki Decodes Bitcoin’s “Banana Zone”, Contrasts with Fiat Currency

Ron Wyden on FISA Reform and Crypto

Latin America's Largest Fintech Bank Integrates Bitcoin Lightning Payments Via Lightspark

bitter pills in crypto mass adoption?

Solana and Cardano Lead Top 10 Crypto Rebound

This Historical Ethereum Top Signal Is Yet To Appear This Cycle

Bitcoin's Trump Card: Dividing Is The Wrong Move

Florida lawmaker pitches ‘Bitcoin for Taxes’ bill

SEC Chair Says Approval Is Going Smoothly

Bitcoin Dropped Below 2017 All-Time-High but Could Sellers be Getting Exhausted? – Blockchain News, Opinion, TV and Jobs

What does the Coinbase Premium Gap Tell us about Investor Activity? – Blockchain News, Opinion, TV and Jobs
BNM DAO Token Airdrop

NFT Sector Keeps Developing – Number of Unique Ethereum NFT Traders Surged 276% in 2022 – Blockchain News, Opinion, TV and Jobs
New Minting Services
A String of 200 ‘Sleeping Bitcoins’ From 2010 Worth $4.27 Million Moved on Friday

Block News Media Live Stream

SEC’s Chairman Gensler Takes Aggressive Stance on Tokens – Blockchain News, Opinion, TV and Jobs

Friends or Enemies? – Blockchain News, Opinion, TV and Jobs

Enjoy frictionless crypto purchases with Apple Pay and Google Pay | by Jim | @blockchain | Jun, 2022

Block News Media Live Stream

How Web3 can prevent Hollywood strikes

Block News Media Live Stream

XRP Explodes With 1,300% Surge In Trading Volume As crypto Exchanges Jump On Board
Block News Media Live Stream
 Altcoins2 years ago
Bitcoin Dropped Below 2017 All-Time-High but Could Sellers be Getting Exhausted? – Blockchain News, Opinion, TV and Jobs
 Binance2 years ago
What does the Coinbase Premium Gap Tell us about Investor Activity? – Blockchain News, Opinion, TV and Jobs
- Uncategorized2 years ago
BNM DAO Token Airdrop
 BTC1 year ago
NFT Sector Keeps Developing – Number of Unique Ethereum NFT Traders Surged 276% in 2022 – Blockchain News, Opinion, TV and Jobs
- Uncategorized3 years ago
New Minting Services

 Bitcoin miners2 years ago
A String of 200 ‘Sleeping Bitcoins’ From 2010 Worth $4.27 Million Moved on Friday
 Video2 years ago
Block News Media Live Stream
 Bitcoin1 year ago
SEC’s Chairman Gensler Takes Aggressive Stance on Tokens – Blockchain News, Opinion, TV and Jobs
