
Bitcoin
Bitcoin “Reserve Risk” Metric Approaches All-Time Lows
Data shows the Bitcoin “reserve risk” indicator has recently plunged down and is now reaching all-time lows only seen back in 2015 bear and the March 2020 COVID crash.
Bitcoin Reserve Risk Suggests HODLing Relative To Price Is Strong
According to the latest weekly report from Glassnode, BTC investors have been holding strong onto their coins despite the large decline in the crypto’s price recently.
Before looking at what the “reserve risk” indicator does, it’s best to get an understanding of a couple concepts first.
A “coin day” is accumulated in the market for each 1 BTC that stays unmoved for a day. The sum of such coin days in the entire market can tell us about how dormant the long-term holder supply has been.
Because of this, the sum of coin days can be an effective way of measuring the conviction of hodlers in the Bitcoin market.
However, there is another way to interpret the coin days and hence the LTH conviction; as Glassnode explains:
Stronger hands will resist the temptation to sell and this collective action builds up an ‘opportunity cost’. Every day HODLers actively decide NOT to sell increases the cumulative unspent ‘opportunity cost’ (called the HODL bank).
The other idea of interest here is the incentive that these LTHs have to sell right now. It is measured through the current price of Bitcoin.
Whenever the price goes up, hodlers become increasingly tempted to realize their profits, and hence the incentive to sell goes up.
Related Reading | First In History: Bitcoin Mayer Multiple Records Lower Value Than Last Cycle’s Low
Now, the reserve risk models the ratio between this “incentive to sell” and the cumulative “opportunity cost” (explained above) of the long-term hodlers. Below is the chart for the indicator.
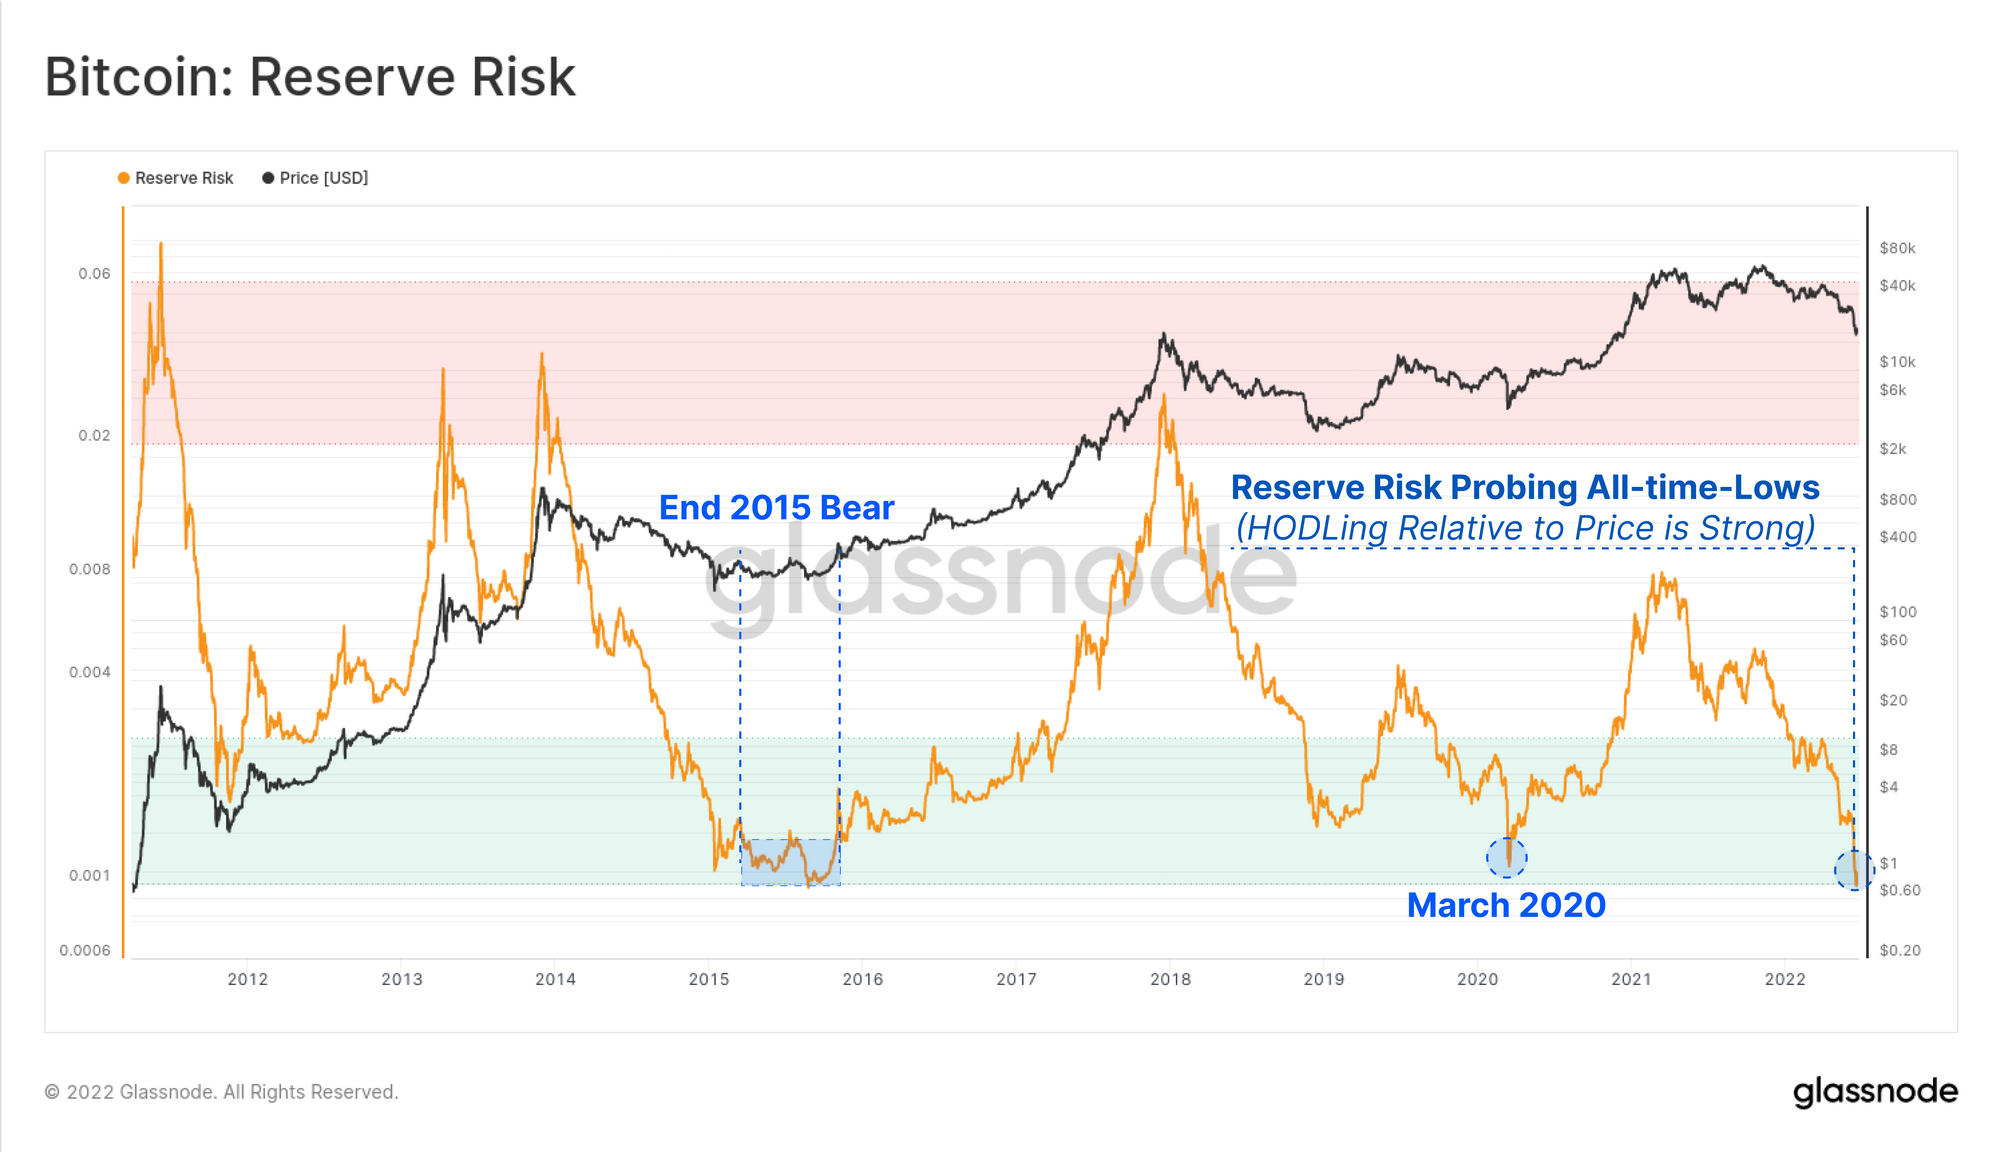
The value of the indicator seems to have sharply declined recently | Source: Glassnde's The Week Onchain - Week 26, 2022
As you can see in the above graph, the Bitcoin reserve risk has gone down in recent days and is now approaching all-time lows.
This suggests that despite the plunging price of the coin during 2022, BTC investors have still been holding strong onto their coins.
Related Reading | Bitcoin Monthly Tags Lower Bollinger Band, Tool’s Creator Hints At Bottom
The last time such low values of the metric were observed was back in the late 2015 bear market and the March 2020 crash.
BTC Price
At the time of writing, Bitcoin’s price floats around $20.9k, down 1% in the past week. Over the last month, the coin has lost 27% in value.
The below chart shows the trend in the value of the crypto over the past five days.
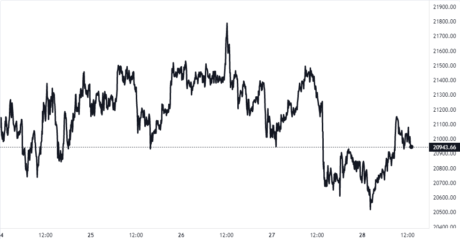
Looks like the price of BTC has been consolidating sideways recently | Source: BTCUSD on TradingView
Featured image from Kanchanara on Unsplash.com, charts from TradingView.com, Glassnode.com
Source link


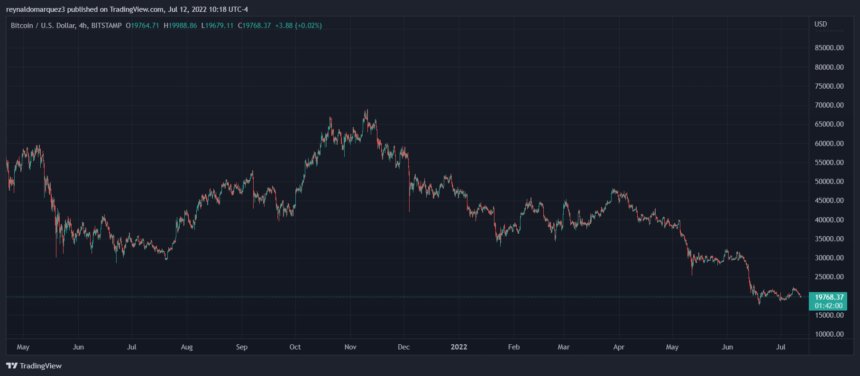
Bitcoin is back below $20,000 and seems on track to re-test the bottom of its current range. The cryptocurrency was showing signs of recovery, but it was rejected near the critical resistance zone at around $22,000.
Related Reading | Tezos (XTZ) Nears 3-Week High – Can Bulls Barrel Towards $1.80?
At the time of writing, BTC’s price trades at $19,800 with a 3% and 2% loss in the last 24 hours and 7 days respectively.
In a recent market update, trading desk QCP Capital addressed the factor that might contribute to BTC’s price moving sideways for the foreseeable future. These included the upcoming Mt. Gox redemptions, and global inflation.
On the probability of the Mt. Gox repayments negatively impacting Bitcoin and the crypto market, QCP Capital wrote:
It is impossible to be certain about the exact impact, given the numerous cross-arguments and theories surrounding the release. Our main takeaway is that there is a high chance of BTC supply flooding the market soon.
In the best-case scenario, Bitcoin will face downside pressure allowing Ethereum and other altcoins to gain some breathing room. The sector might record some gains after an extended period of increased Bitcoin dominance.
The worst-case scenario is additional selling pressure for Bitcoin, as QCP Capital said, and the entire crypto market pushing prices to their yearly lows or deeper into bear market territory. A lot depends on Mt. Gox’s unlock schedule, and if the victims will succumb to market uncertainty or wait for BTC’s price to reclaim previous highs.
QCP Capital made the following prediction on what could be in store for Bitcoin in the short term.
We’re not outrightly bearish at these spot levels but we think the sudden demand for call structures might have pushed the risk reversal levels a bit too much to the topside. Our base case continues to be sideways trading with the risk of sharp dips and upside capped (…).
What Could Push Bitcoin Back Into The Green
Tomorrow, the U.S. will publish a new Consumer Price Index (CPI) print. After an aggressive shift in monetary policy from the U.S. Federal Reserve (Fed), market participants expect a decline in this metric.
If the CPI print signals a decline in inflation, the crypto market could see some relief. $18,600 and $22,000 will continue to operate as major support and resistance levels.
Related Reading | Are North Korean IT Remote Workers Targeting Crypto Firms? Here’s What We Know
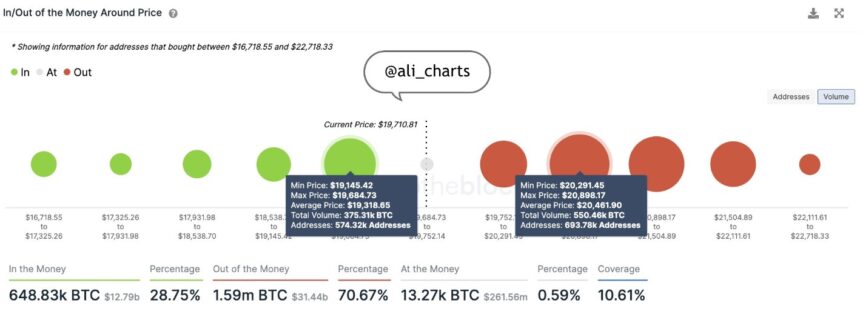
In addition, analyst Ali Martinez indicated that Bitcoin is sitting at an “important demand wall”. There are 570,000 addresses that purchased BTC around its current levels, to the upside $20,900 is the next level to watch in case of bullish momentum, as seen in the chart below.
Source link
Jul 11, 2022 13:42 UTC
| Updated:
Jul 11, 2022 at 13:42 UTC
New legislation tailored to control the crypto area in port aims to implement a licensing regime for crypto service suppliers. The individual changes to the region’s anti-money lavation (AML) rules are submitted to its law-makers whereas a recently printed report examines relevant threats.
Hong Kong Lawmakers to Review Bill Aligning Crypto Sector With Financial Industry
Amendments designed to control the cryptocurrency market in port are bestowed to the members of the law-makers of China’s special body region. The Anti-Money lavation and CoCounter-Terrorist FinancingAmendment) Bill 2022, that was printed within the government gazette in June, wants their approval in 2 readings to become law.
The authors of the draft introduce licensing for virtual quality service suppliers (VASPs) and registration for dealers in precious metals and stones (DPMS). The goal is to impose anti-money lavation and counter-terrorist finance obligations on the companies operative within the 2 sectors.
Entities operating with cryptocurrencies that need to launch a mercantilism platform, for instance, would have to be compelled to get a license from the port Securities and Futures Commission (SFC) and fulfill a variety of necessities. The proposal takes into consideration the recommendations of the monetary Action Task Force on concealing (FATF) that sets the world standards within the field.
The new necessities for VASPs ar cherish those who apply to ancient establishments within the monetary services sector and that they can have to be compelled to meet similar monetary adequacy necessities, Andrew Leelarthaepin, crypto exchange Bitstamp’s manager for Asia Pacific, noted in article printed by the South China Morning Post. In his opinion, that acknowledges crypto corporations as an element of Hong Kong’s financial set-up. the chief elaborated:
Put simply, VASPs will expect to be regulated to an equivalent normal as our institutional shoppers. The law acknowledges VASPs as peer organizations at intervals in the monetary services sector.
Under the forthcoming legislation, the SFC will be accountable to confirm that virtual quality service suppliers adopt correct listing and mercantilism policies also as monetary news and revelation procedures. The Commission will observe the implementation of mechanisms designed to stop market manipulation and conflicts of interest.
As legislators prepare to approve the new regulative framework, the newest edition of Hong Kong’s concealing and Terrorist finance Risk Assessment Report has paid explicit attention to the threats and vulnerabilities within the crypto area. while acknowledging their potentials and increasing quality, the document conjointly highlights the vulnerability of virtual assets to numerous risks and also the challenges they create for capitalist protection.
Clark
Head of the technology.
Source link
Bitcoin (BTC) could undergo a massive price recovery in the coming months, based on an indicator that marked the 2015 and 2018 bear market bottoms.
What’s the Bitcoin Pi Cycle bottom indicator?
Dubbed “Pi Cycle bottom,” the indicator comprises a 471-day simple moving average (SMA) and a 150-period exponential moving average (EMA). Furthermore, the 471-day SMA is multiplied by 0.745; the outcome is pitted against the 150-day EMA to predict the underlying market’s bottom.
Notably, each time the 150-period EMA has fallen below the 471-period SMA, it has marked the end of a Bitcoin bear market.
For instance, in 2015, the crossover coincided with Bitcoin bottoming out near $160 in January 2015, followed by an almost 12,000% bull run toward $20,000 in December 2017.
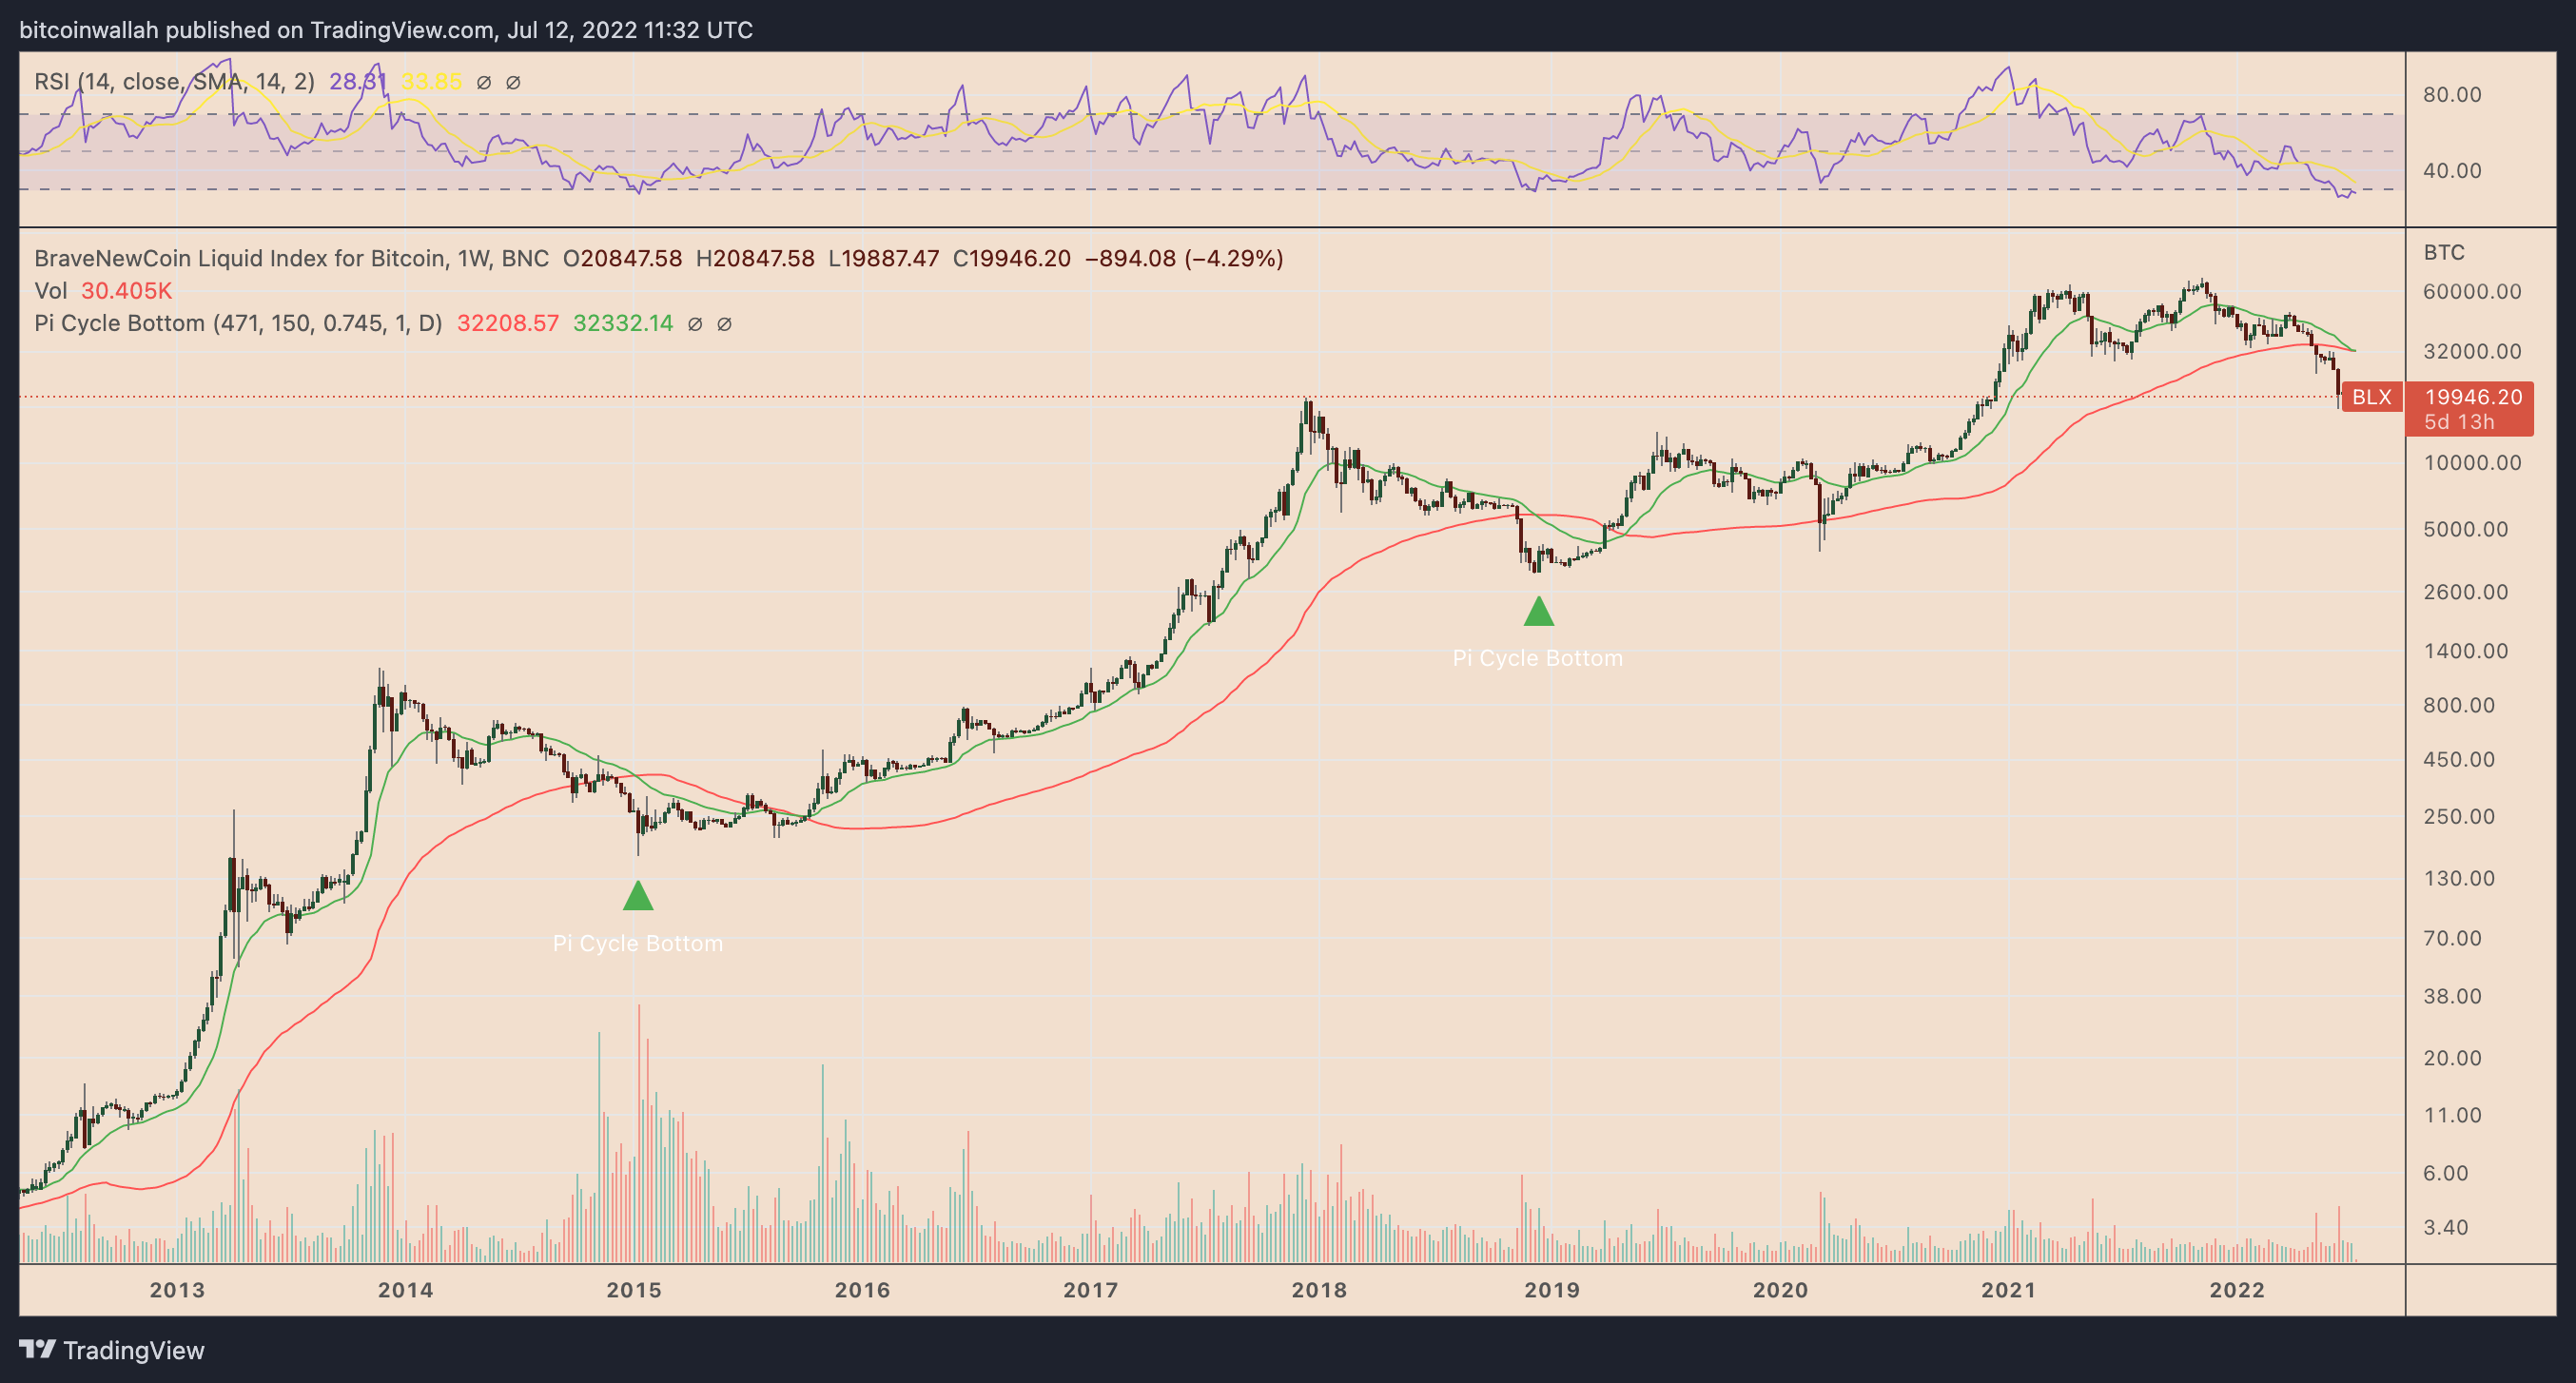
Similarly, the second 150-471 MA crossover in history marked the end of the 2018 bear cycle. It also followed a 2,000% price rally — from nearly $3,200 in December 2018 to $69,000 in November 2021.
Only the third time in history
This week, Bitcoin’s 150-day EMA (at $32,332 as of July 12) is set to close below its 471-day EMA (at $32,208), thus logging the third Pi Cycle bottom in its history.
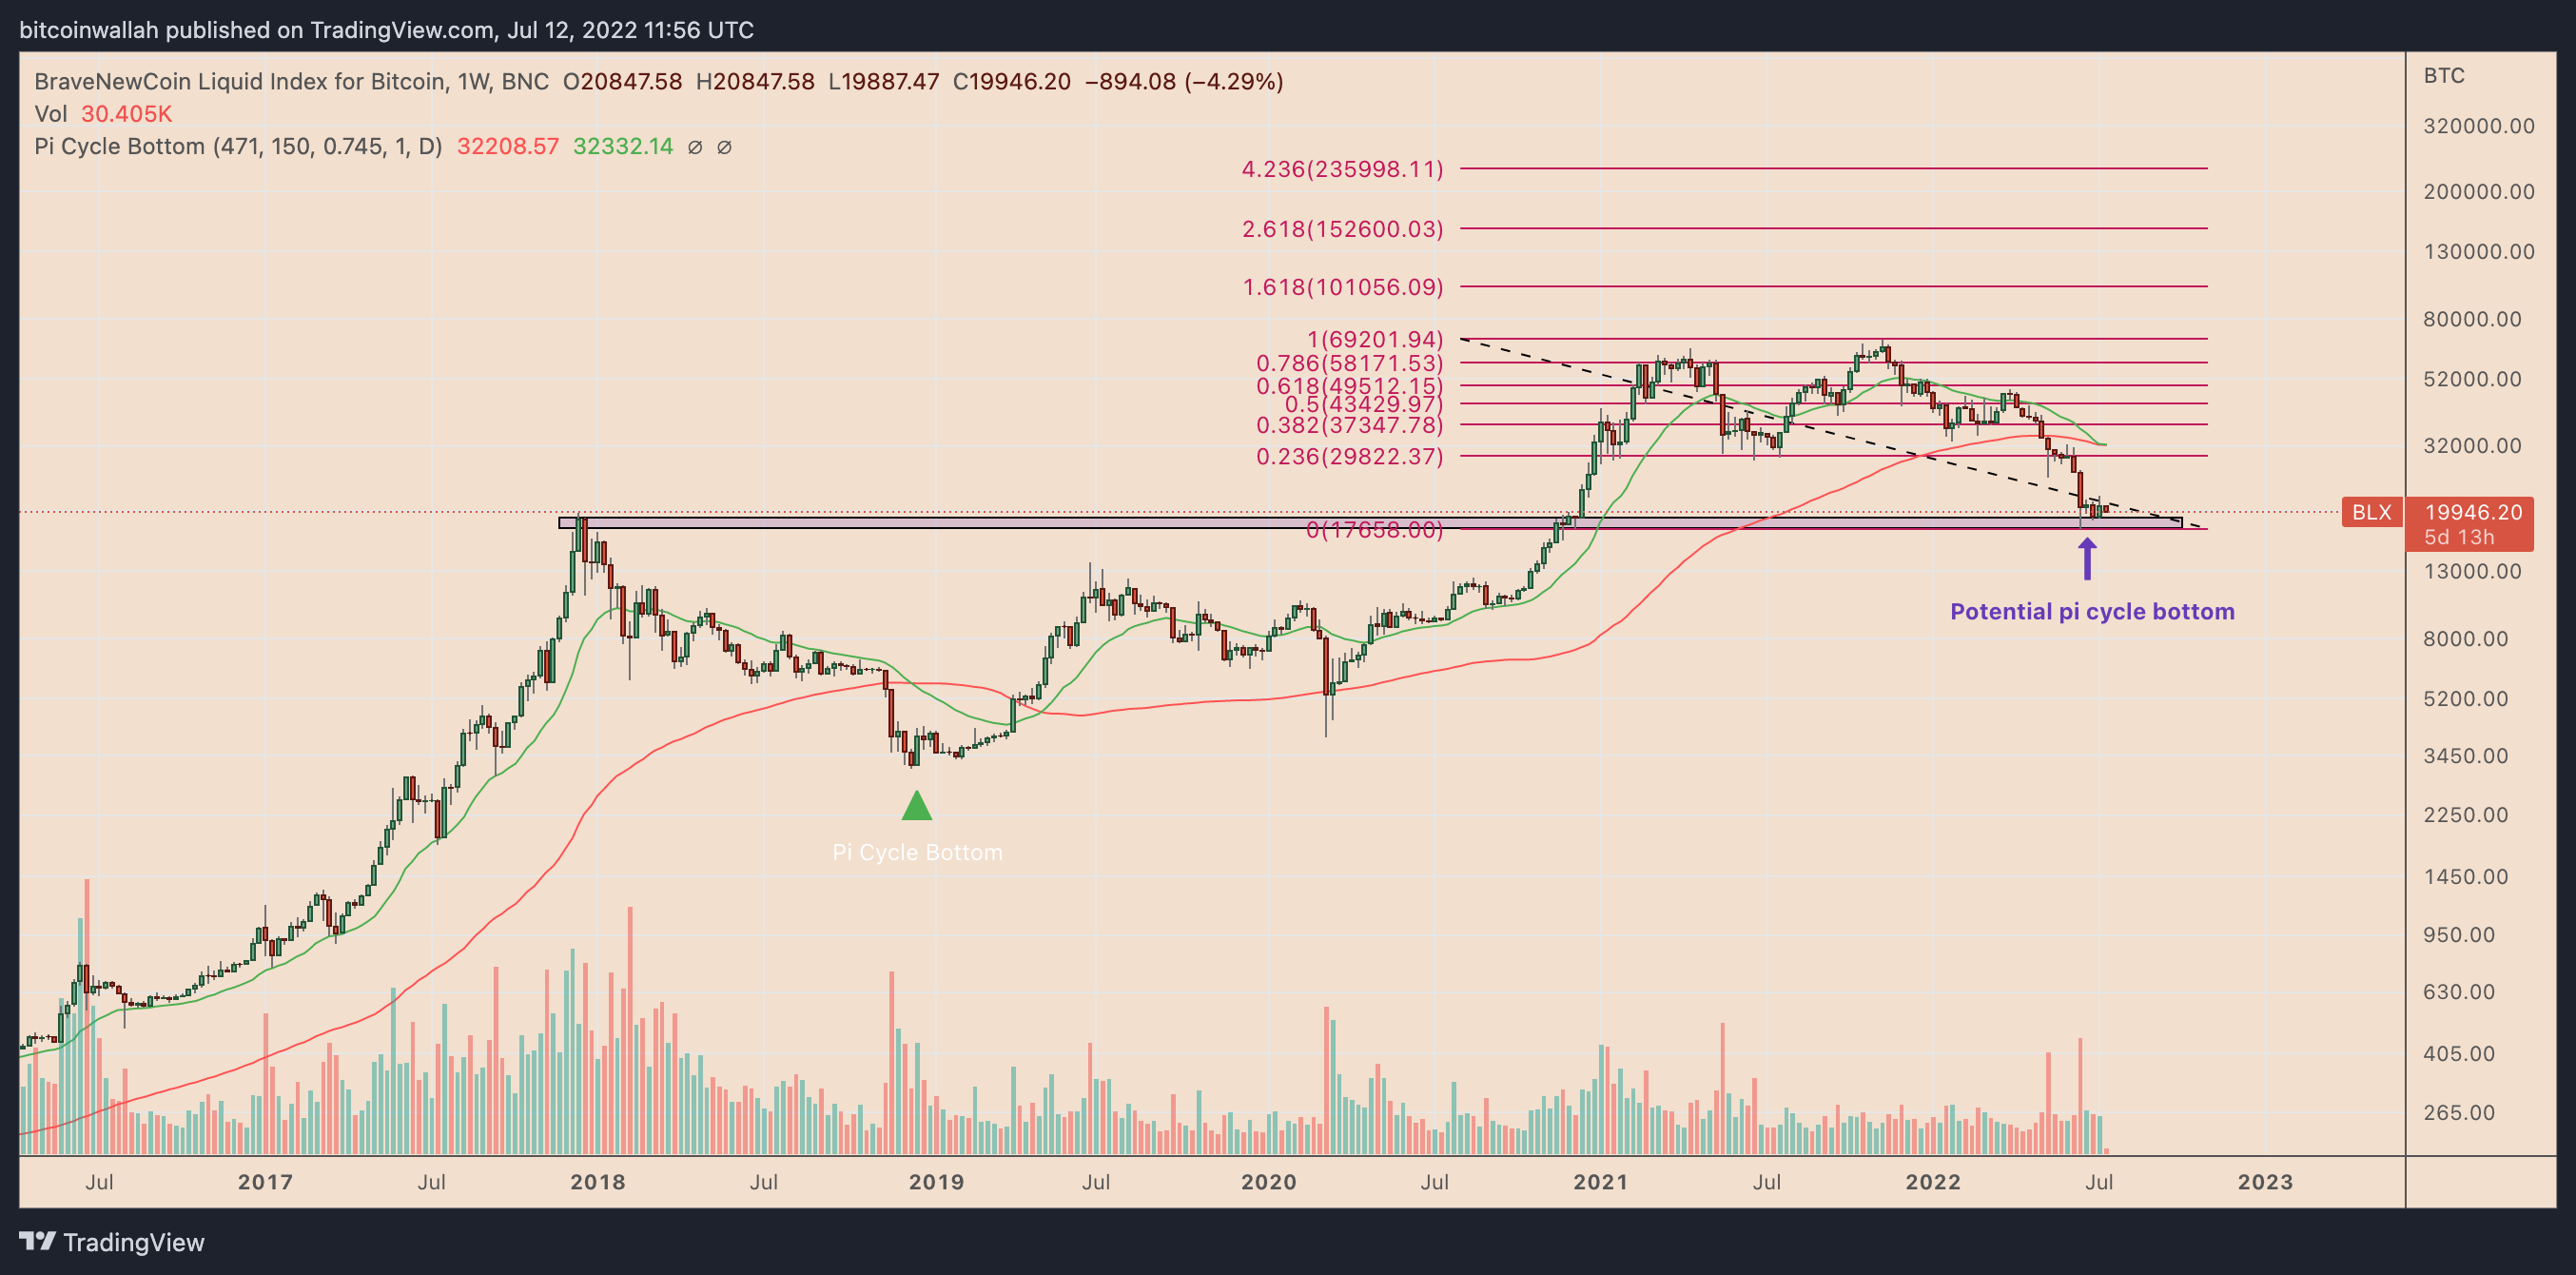
The crossover appears as Bitcoin wobbles around $20,000, after a 75%-plus price correction from its peak level of $69,000.
Related: Bitcoin price may bottom at $15.5K if it retests this lifetime historical support level
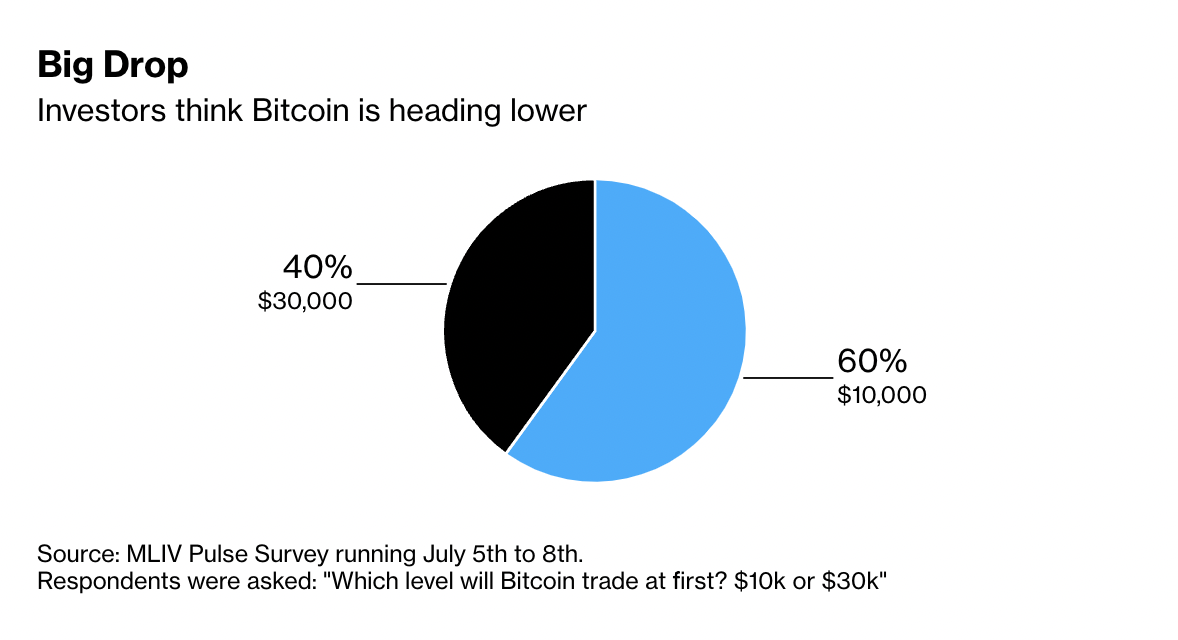
The BTC/USD pair has been flirting with the level for almost a month, with the latest MLIV Pulse survey noting that its price has more possibility to fall toward $10,000 than rebound toward $30,000.
The fears emerge due to an ongoing crypto market carnage led by the failure of several high-profile companies.
Meanwhile, hawkish central bank policies that focus on removing excess cash from the economy have also spooked investors.
Nevertheless, Bitcoin could rebound to at least $30,000 if the given bottom fractal plays out. The interim upside target coincides with the 0.236 Fib line of the Fibonacci retracement graph drawn from the $69,000-swing high to the $17,000-swing low, as shown in the chart above.
The views and opinions expressed here are solely those of the author and do not necessarily reflect the views of Cointelegraph.com. Every investment and trading move involves risk, you should conduct your own research when making a decision.
Source link

Into Crab Mode, Bitcoin Bullish Potential Capped For The Coming Months?

How to build a passive income stream from cloud mining?
Successful Beta Service launch of SOMESING, ‘My Hand-Carry Studio Karaoke App’

List of TOP BTC Gambling Sites
US Treasury Delivers Crypto Framework to Biden as Directed in Executive Order

Bitcoin price indicator that marked 2015 and 2018 bottoms is flashing
Successful Beta Service launch of SOMESING, ‘My Hand-Carry Studio Karaoke App’

Tezos (XTZ) Nears 3-Week High
How a Presale Ethereum Wallet Containing 1000 ETH Was Recovered by KeychainX

Ethereum co-founder responds to PoS critics amid upcoming Merge

theBlock Research Pins Stacks as a Key Player in the BTC Network

Bitcoin price hits 7-day low as US warns of ‘highly elevated’ CPI data

Bitcoin Erases Last Week Gains As Price Sinks Below $20,000

The UK’s largest Bitcoin conference comes to Scotland

Are North Korean IT Remote Workers Targeting Crypto Firms? Here’s What We Know
BNM DAO Token Airdrop
New Minting Services

Could an Earnings Recession Lead to More Pain for Crypto? – Blockchain News, Opinion, TV and Jobs

‘Crypto is just like the end of the 90s with the internet bubble,’ says Hodl CEO Maurice Mureau

Virginia passes new crypto law whilst macro headwinds mount up – Blockchain News, Opinion, TV and Jobs

Interview with Ruud Feltkamp, Owner of AI-driven Trading Bot Cryptohopper – Blockchain News, Opinion, TV and Jobs

A Bear of Historic Proportions – Blockchain News, Opinion, TV and Jobs

High-profile BAYC collector denies allegations of wrongdoing brought by DeFi detective

BNM Live Stream

Tesla, Blockstream and Jack Dorsey’s Block Team-up to Mine Bitcoin Sustainably – Blockchain News, Opinion, TV and Jobs

Are expiring copyrights the next goldmine for NFTs?

Block News Media Live Stream

Live Stream Block News Media

CULT DAO’s Revolt 2 Earn Concept Draws the Attention of Anonymous – Blockchain News, Opinion, TV and Jobs

Fintech-Ideas brings blockchain functionality to its range of platforms – Blockchain News, Opinion, TV and Jobs
-
Uncategorized6 months ago
BNM DAO Token Airdrop
-
Uncategorized8 months ago
New Minting Services
-
 bear market2 weeks ago
Could an Earnings Recession Lead to More Pain for Crypto? – Blockchain News, Opinion, TV and Jobs
-
 Blockchain2 weeks ago
‘Crypto is just like the end of the 90s with the internet bubble,’ says Hodl CEO Maurice Mureau
-
 Bitcoin2 weeks ago
Virginia passes new crypto law whilst macro headwinds mount up – Blockchain News, Opinion, TV and Jobs
-
 Blockchain2 weeks ago
Interview with Ruud Feltkamp, Owner of AI-driven Trading Bot Cryptohopper – Blockchain News, Opinion, TV and Jobs
-
 bear markets2 weeks ago
A Bear of Historic Proportions – Blockchain News, Opinion, TV and Jobs
-
 Blockchain Analytics2 weeks ago
High-profile BAYC collector denies allegations of wrongdoing brought by DeFi detective