
Price analysis
Can TON Leverage $700 Million TVL To Hit New High?
Toncoin Price Analysis: On the weekend, the cryptocurrency market remains neutral, projecting no clear dominance from buyers to sellers. Following the Bitcoin consolidation over $60000 support, most major altcoins showcase sluggish price behaviors the whole week waiting for a better reversal signal. Amid the uncertainty, the TON price trades on a slightly positive note attempting a breakout from the $7.6 resistance to regain bullish momentum.
Also Read: Bitcoin In Spotlight With Michael Dell’s Latest Poll, Is Dell Going Big On BTC?
Toncoin Price Analysis: TON Sees 113% TVL Growth and Key Regulatory Approval

Despite the June market downturn, Toncoin maintained its bullish momentum, rising from a monthly low of $6.275 to a trading price of $7.68, registering a 22.5% increase. This rally was driven by a surge in network activity, broader adoption, and the introduction of Play-to-Earn games on Telegram, all of which played crucial roles in its recovery.
Recently, the Astana Financial Services Authority (AFSA) has officially approved Toncoin (TON) for trading in Kazakhstan, following a comprehensive review that confirmed its compliance with regulatory standards.
This inclusion is expected to attract a new wave of institutional and retail investors, providing them with secure and transparent trading options within the regulated environment of the AIFC.
In a recent tweet, renowned trader Alicharts highlighted a surge in Toncoin investments, revealing that whales have purchased over 45 million TON valued at around $346.5 million over the past week. This accumulation accentuates strong investor confidence in the future potential of this asset.
Whales have bought more than 45 million #Toncoin $TON over the past week, worth around $346.5 million! pic.twitter.com/P3UKHHjHcU
— Ali (@ali_charts) June 30, 2024
By press time, the Toncoin trades at $7.66 and maintains its position as the eighth largest cryptocurrency with a market cap of $18.84 Billion.
Additionally, the Total Value Locked (TVL) on the Toncoin Network has continued to expand, reaching $700 million on Sunday, according to DefiLlama data. With a substantial 113.41% increase in TVL in June, the network demonstrates robust growth and increasing adoption among market participants.

With a modest intraday gain of 1.4%, the TON price is heading high to soon challenge immediate resistance of $7.86.
If buyers flip the overhead resistance into suitable support, the Toncoin could surpass $8.28 and target the $9 mark, followed by $10.5.
However, if the market supply pressure persists, the TON price could plunge 4-.5% and seek support at the ascending trendline since mid-March. The dynamic support bolsters buyers with suitable accumulation points and stable higher-low formation.
Technical Indicator
- EMA: The coin price trading above the fast-moving 20D and 50D Exponential Moving Averages indicates the buyers are still active toward the asset.
- ADX: The Average Directional Index slope falls to 11.5% indicating the ongoing consolidation has stabilized the price after the last rally, which is favorable for a fresh recovery trend.
Frequently Asked Questions (FAQs)
Regulatory approval from the Astana Financial Services Authority (AFSA) significantly impacts Toncoin by providing a formal and secure framework for trading within Kazakhstan
Total Value Locked (TVL) refers to the total amount of assets that are currently being held within a blockchain network’s smart contracts. This metric is crucial as it reflects the overall health and growth potential of the network.
Trading above the 20-day and 50-day Exponential Moving Averages (EMAs) indicates that Toncoin is currently in a strong upward momentum in the short to medium-term.
Related Articles
The presented content may include the personal opinion of the author and is subject to market condition. Do your market research before investing in cryptocurrencies. The author or the publication does not hold any responsibility for your personal financial loss.
Source link


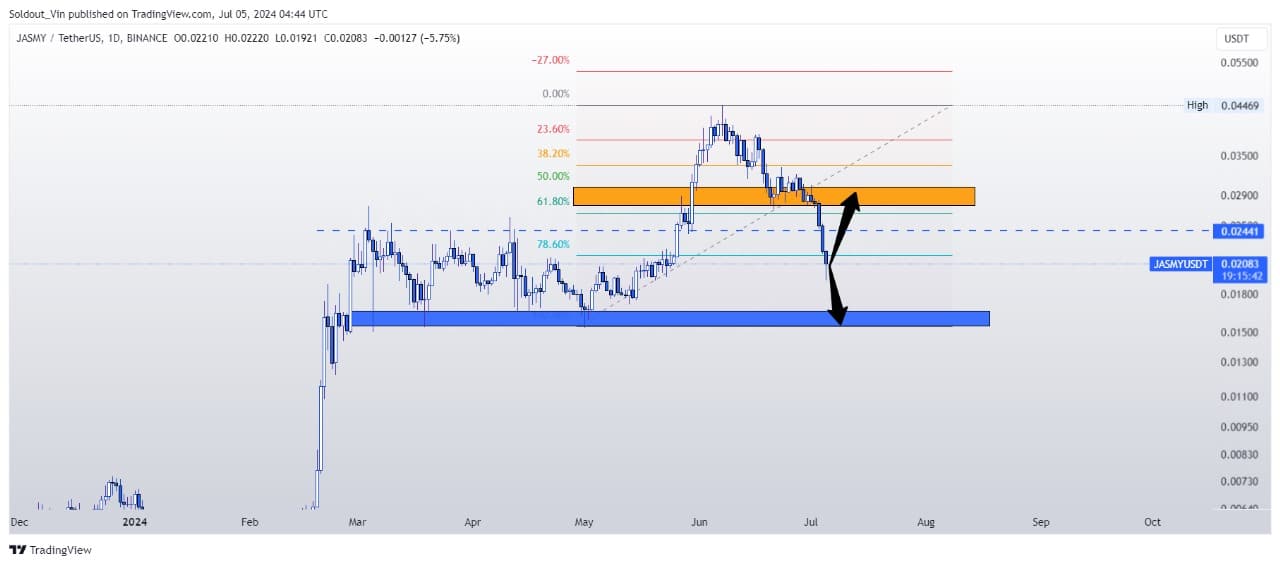
JasmyCoin Price Analysis: Jasmy price is down 20.6% following the ongoing market bleeding on account of the Bitcoin sell-off. The price of JASMY hovered around $0.019 during European business hours on Friday, a 36% crash in the last 7 days. Nevertheless, crypto enthusiasts remain hopeful, calling this the last pullback before the main bull run. Are they correct?
JasmyCoin Price Analysis Hints at Further Downside to $0.015

JASMY’s price had a good run following the misconstrued news of its partnership with Apple. After the hype, the sell-off began, and unfortunately for JasmyCoin, the sell-off has been further exacerbated by the current Bitcoin downturn. Bitcoin’s current market dominance of 51.8% means its price volatility affects the majority of the altcoins in the market.
The price of JASMY is surprisingly still trending above the 200-day simple moving average (SMA), despite the heavy drop in value. This indicator may provide some support around $0.02 but if Bitcoin continues to bleed, JASMY’s price may fall lower and find further support around $0.015
If JASMY bulls decide to push the price higher from this level, the asset may increase by 42% back to around $0.028, which coincides with the 0.618 Fibonacci retracement level.
The JASMY 14-day relative strength index (RSI) is at 30—almost breaking into the oversold area. This means market participants can expect heightened selling momentum over the weekend before a reversal.
Crypto Analysts Maintain Bullish Stance on JasmyCoin Price
Despite the flailing price, crypto market analysts have maintained a bullish outlook on the price of JAMSY. JasmyCoin’s bullish prospects include its role in the Internet of Things (IoT) sector, potential technological adoption, and positive market sentiment.
$JASMY (JasmyCoin)’s price made an over +1,180% move since the attached analysis, from ≈$0.003125 to $0.040115, and “The Path to $2.90+” REMAINS 💥!
This particular technical setup can imply another near 71X (Over +7,000%) and the process looks more than underway.
“First they… https://t.co/7Vkm4x1LAq pic.twitter.com/H1izdFD7wZ
— JAVON⚡️MARKS (@JavonTM1) June 3, 2024
Javon Marks, a crypto analyst on X (formerly Twitter), predicted a 15X move from JASMY on its path to $2.9. This analysis was an update of another he did in October 2023, citing that nothing has changed.
Zooming out to the larger bull channel on the weekly. True test coming at mid channel support. It held back in April/May. Let’s see if history repeats 🙈⛽ $JASMY pic.twitter.com/rBlmfWRuIL
— 𝒯𝒽𝑒 𝒞𝒶𝓃𝒹𝓁𝑒 𝒲𝒾𝒸𝓀🕯️ (@Fresh_Fontana) July 4, 2024
The Candle Wick, another crypto analyst, predicts a JASMY price may bounce off the midline of an ascending channel, as it did back in April.
While these analyses remain bullish, the possibility of further downside is palpable, as everything depends on BTC’s next move. Bitcoin price prediction indicates a potential downside over the weekend to the $50,000 area before a bounce back up. This may affect JASMY’s price negatively.
Bottom Line
JasmyCoin’s value plummeted 20% in the wake of a broader Bitcoin sell-off, indicating the ripple effect that major cryptos can have on smaller altcoins. This sharp decline shows how interconnected the digital assets in the crypto market are.
Related Articles
The presented content may include the personal opinion of the author and is subject to market condition. Do your market research before investing in cryptocurrencies. The author or the publication does not hold any responsibility for your personal financial loss.
Source link


LayerZero (ZRO) is a project focused on the task of interoperability, connecting different blockchain networks so that they are compatible with each other.
In the same way that the internet eventually fell under standardized protocols after a decade of development, LayerZero’s ambitious goal is to standardize blockchain app development throughout the Web3 space.
What is the LayerZero token price right now?
ZRO is currently trading at $ 3.93, up 39.8% over the last 7 days.
LayerZero token price is also inching closer towards its all-time high of $4.57 which it reached on June 20 before slumping to $2.51 a week later, becoming the biggest loser in the crypto market for the day and shedding $600 million from its market capitalization.
The current market cap is over $400 million.
It’s worth noting that ZRO price history only goes back as far as June 20. This is a new, high-risk project with no track record in terms of proven utility as of yet.
What is causing LayerZero coin price to rise?
There are no particular project developments or ZRO coin news that could be pumping the price of ZRO. Heavy volatility for a brand-new and untested coin is not uncommon.
The project saw ZRO price falling towards the end of June when some users reported not receiving their share of a major airdrop used to promote the launch.
Developers corrected this error after receiving the complaints. It’s also apparent that many crypto users fell prey to a LayerZero scam impersonating the real team and soliciting airdrop purchases without any reward in store. Overall, the tumultuous airdrop likely caused doubt and uncertainty in the stability of the price, contributing to the volatility.
After seeing a strong start turn to a major correction, many traders may have viewed the price drop as an opportunity to buy ZRO at what they considered to be an undervalued rate, causing a major surge in price.
ZRO coin price prediction 2024 – 2025
As ZRO is a brand new coin, there’s really no telling what the coin will do next. However, we can outline some important factors that traders might do well to keep in mind when assessing the value of the project.
Firstly, the utility of the project can be examined. Interoperability is a crucial step in expanding the Web3 ecosystem, and LayerZero is certainly cashing in on the promise of being a big player in that space.
Savvy investors will likely be studying the track record of the team’s work history and the success of their past projects as well as the viability of LayerZero’s value proposition in general when making a decision.
LayerZero (ZRO) utility
Can LayerZero really standardize blockchain app development?
What we do know is that the team are not anonymous, alleviating concerns among some crypto investors, with LayerZero founded in 2021 by Bryan Pellegrino (CEO), Ryan Zarick (CTO), and Caleb Banister. The project raised $120 in Series B funding in 202.3.
The project claims to be more secure and scalable than Cosmos, a competitor in the blockchain ineroperability space, although this has not yet been fully explored and proven right or wrong as of yet.
With major backers like Sequoia Capital behind them and competent leadership, the project could indeed position itself to corner a piece of the market in years to come.
However, at just two weeks old, ZRO is a risky purchase with no price history to review. Investors could gain an understanding of the project by reading the whitepaper and gaining a sense of LayerZero’s potential edge over competitors when considering ZRO as a possible investment.
Disclosure: This article does not represent investment advice. The content and materials featured on this page are for educational purposes only.
Source link
Pepe Coin Price Analysis: On Wednesday during the Asian trading hours, the crypto market witnessed a surge in selling pressure as Bitcoin price fell nearly 4%. The BTC revisiting the $60000 sparked the possibility of a downtrend continuation in most of the major altcoins including PEPE. The Frog-themed memecoin is down 8% today, extending the correction fall with a channel setup. Should you stay invested?
Also Read: PEPE Price: Whale Sacks 1.2 Tln Coins Amid Monthly Crash, Is Price Gearing Up For Rally?
Pepe Coin Price Analysis: Whale Dumps $112,000 Worth of Tokens Amid Downtrend

The current correction trend in Pepe coin was initiated at May End as the price reverted from $0.00001725. Since then, the meme coin has witnessed a steady downtrend of lower highs and lows resonating with two downsloping trendlines.
The bearish turnaround has tumbled the asset 39% down to $0.00001048, while the market cap plunged to $4.42 Billion. An analysis of the daily chart shows the falling trendline reveals the formation of a bull flag pattern. This chart pattern is known to drive temporary counter-trend moves for buyers to recuperate their strengths.
Despite the correction, the PEPE price is still above the 50% Fibonacci retracement tool indicating the long-term trend remains bullish and buyers remain a dominant force in this asset.
However, the PEPE is currently in downward momentum and a recent sell-off from smart money hints at a breakdown below $0.00001. A major whale, dimethyltryptamine.eth, has re-engaged with PEPE after a 10-month hiatus, selling 10 billion PEPE tokens (worth $112,000) for 32.73 ETH.
Also Read: Binance Announces Delisting Of Key Crypto Pairs, Brace For Market Impact
After over 10 months of inactivity with $PEPE, dimethyltryptamine.eth returned to sell 10B $PEPE ($112K) for 32.73 $ETH ~5hrs ago.
Notably, dimethyltryptamine.eth was an early $PEPE buyer who turned $45K into $26.7M (+58.6K%).
Currently, the whale holds 1.99T $PEPE ($21.9M).… pic.twitter.com/dlTwu3Q4u9
— Spot On Chain (@spotonchain) July 3, 2024
Early investment by this whale turned $45,000 into $26.7 million, marking a 58.6% gain. Currently holding 1.99 trillion PEPE tokens valued at $21.9 million, the whale’s activity underscores the profitability of early investments. However, the recent sell-off suggests the large holder may not expect a strong upside in PEPE in the near time.
Thus, a breakout from the flag pattern resistance is necessary to end the current correction trend. With sustained buying, the post-breakout rally could surpass $0.0000135 and rechallenge the $0.00001725 peak.
Technical Indicator
- BB Indicator: The downtick in the lower Bollinger Band accentuates aggressive selling and no sign of reversal yet.
- ADX: An uptick in the daily Average Directional Index slope at 20% indicates the sellers are gaining momentum which could lead to a prolonged downfall.
Frequently Asked Questions (FAQs)
A bull flag pattern is a technical chart pattern that resembles a small rectangular consolidation of price movement within a prevailing uptrend. It suggests a temporary pause before the uptrend continues.
The 50% Fibonacci retracement tool is a technical analysis tool used to identify potential support and resistance levels by measuring the halfway point of a prior price movement.
The ADX (Average Directional Index) indicator measures the strength of a trend, with higher values indicating a stronger trend.
Related Articles
The presented content may include the personal opinion of the author and is subject to market condition. Do your market research before investing in cryptocurrencies. The author or the publication does not hold any responsibility for your personal financial loss.
Source link

MATIC Price Crash: Reaching A Two Year Low

Multicoin Pledges up to $1M for Pro-Crypto Senate Candidates

Crypto heists near $1.4b in first half of 2024: TRM Labs

FTX Founder Sam Bankman-Fried’s Family Accused Of $100M Illicit Political Donation

Bitcoin Price Falls as Mt Gox Starts Repayments

20% Price Drop Follows $87 Million Spending Outrage

More than 10 years since the collapse of Mt. Gox, users confirm reimbursements

Leading Telecom Company Taiwan Mobile Gets Crypto Exchange License

Here Are Price Targets for Bitcoin, Solana, and Render, According to Analyst Jason Pizzino

Bitcoin price plunges below $55k as Mt. Gox announces repayments

Jasmy Sheds 20% Amid Bitcoin Sell-Off

Are they a good thing?

Mt. Gox Transfers $2.7 Billion in Bitcoin From Cold Storage Amid Market Rout

What’s Next For Ethereum (ETH) as Price Hovers $3,000?

Bitcoin’s quick dip below $57k forces beginners to capitulate, CryptoQuant says

Bitcoin Dropped Below 2017 All-Time-High but Could Sellers be Getting Exhausted? – Blockchain News, Opinion, TV and Jobs

What does the Coinbase Premium Gap Tell us about Investor Activity? – Blockchain News, Opinion, TV and Jobs
BNM DAO Token Airdrop

NFT Sector Keeps Developing – Number of Unique Ethereum NFT Traders Surged 276% in 2022 – Blockchain News, Opinion, TV and Jobs
A String of 200 ‘Sleeping Bitcoins’ From 2010 Worth $4.27 Million Moved on Friday
New Minting Services

Block News Media Live Stream

SEC’s Chairman Gensler Takes Aggressive Stance on Tokens – Blockchain News, Opinion, TV and Jobs

Friends or Enemies? – Blockchain News, Opinion, TV and Jobs

Enjoy frictionless crypto purchases with Apple Pay and Google Pay | by Jim | @blockchain | Jun, 2022

How Web3 can prevent Hollywood strikes

Block News Media Live Stream

Block News Media Live Stream
Block News Media Live Stream

XRP Explodes With 1,300% Surge In Trading Volume As crypto Exchanges Jump On Board
 Altcoins2 years ago
Bitcoin Dropped Below 2017 All-Time-High but Could Sellers be Getting Exhausted? – Blockchain News, Opinion, TV and Jobs
 Binance2 years ago
What does the Coinbase Premium Gap Tell us about Investor Activity? – Blockchain News, Opinion, TV and Jobs
- Uncategorized3 years ago
BNM DAO Token Airdrop
 BTC1 year ago
NFT Sector Keeps Developing – Number of Unique Ethereum NFT Traders Surged 276% in 2022 – Blockchain News, Opinion, TV and Jobs

 Bitcoin miners2 years ago
A String of 200 ‘Sleeping Bitcoins’ From 2010 Worth $4.27 Million Moved on Friday
- Uncategorized3 years ago
New Minting Services
 Video2 years ago
Block News Media Live Stream
 Bitcoin1 year ago
SEC’s Chairman Gensler Takes Aggressive Stance on Tokens – Blockchain News, Opinion, TV and Jobs

✓ Share: