
ChainLink (LINK)
Chainlink Rises 17% – Is LINK On Course To Hit $20 This Week?
Traders in the crypto realm are watching Chainlink (LINK) with bated breath as the price coils up near the $16 mark, hinting at a possible break out towards $17, or even $20 given the right conditions this week.
Since November, LINK has been consolidating between $13.00 and $17.00, exhibiting classic market cycle behavior that presents prime opportunities for savvy traders.
Technical analysts are buzzing with potential bullish scenarios, with many pointing to the current price action as the telltale sign of an “accumulation phase.” As per the renowned Wyckoff method, this phase sees sellers exiting, prices stabilizing, and indecision ruling the market.
Will Chainlink Hit The Vaunted $20 Mark?
Following accumulation comes the much-anticipated “markup phase,” characterized by surging buying pressure, rapid price increases, and heightened activity.
And that’s precisely what the charts seem to be foreshadowing for LINK. Indicators like the Awesome Oscillator and MACD are flashing green and pushing towards bullish territory, suggesting growing confidence and impending upward momentum.
Chainlink currently trading at $15.57682 on the daily chart: TradingView.com
The Relative Strength Index (RSI) also leans north, potentially primed to cross its signal line and add fuel to the bullish fire.
Further bolstering the optimistic outlook are the Simple Moving Averages (SMAs). Both the 100- and 200-day SMAs are pointing north, with the latter currently nestled comfortably at $9.994. This upward trajectory indicates the path of least resistance lies in ascending territory for LINK.
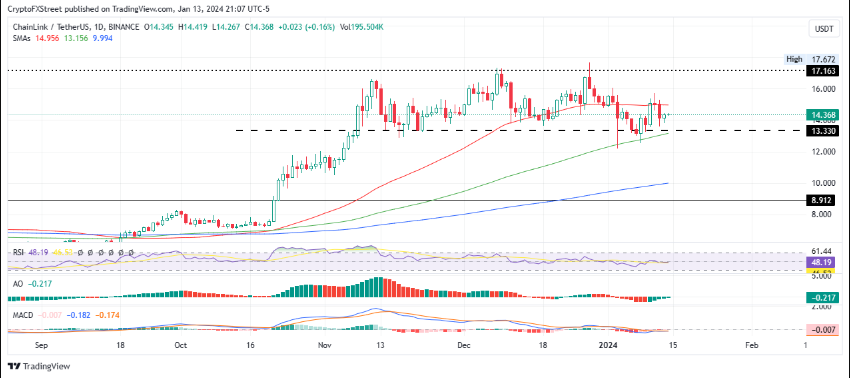
Source: TradingView
Should buying pressure build steam above current levels, analysts predict a potential leapfrog over the 50-day SMA at $16.95, paving the way for a psychological $17 price point. In a highly bullish scenario, LINK could even tap into its full $20 potential, marking a 20% surge from its current position.
LINK price up nearly 17% in the weekly timeframe. Source: Coingecko
17% Rally Ignites More Optimism For LINK
But a fresh spark ignites the conversation – Chainlink just surged 17% today, propelling it closer to the long-held $17 barrier. Could this recent rally be the catalyst that sends LINK rocketing past its immediate target and into uncharted territory?
It’s still too early to definitively say. While the technical indicators remain encouraging, external factors and market sentiment can shift rapidly. However, one thing is certain: Chainlink’s latest surge adds another layer of intrigue to its already captivating price action.
Whether it coils upward for a glorious breakout or succumbs to profit-taking, the next few days promise to be a thrilling ride for LINK holders and a fascinating case study for technical analysis enthusiasts alike.
Featured image from iStock
Disclaimer: The article is provided for educational purposes only. It does not represent the opinions of NewsBTC on whether to buy, sell or hold any investments and naturally investing carries risks. You are advised to conduct your own research before making any investment decisions. Use information provided on this website entirely at your own risk.
Source link


Cryptocurrencies entered July with a strong conviction to reverse the negative trend in June. Bitcoin rebounded above $60,000, sending bullish signals among altcoins which not only followed Ethereum’s reversal past $3,400 but posted remarkable gains. Cryptocurrencies to buy like Solana (SOL), Dogecoin and Cardano pushed upwards amid growing optimism for spot ETFs in the US.
As investors beam with the hope of a bull run in H2 of the year, it is important to identify cryptocurrencies to buy showing potential to grow exponentially and reach new all-time highs in price and market capitalization.
For many crypto projects, reaching the coveted top ten tier is not a small feat. Such an achievement often signifies commendable network growth, ecosystem expansion, and high competitiveness.
Seeking exposure to such cryptocurrencies to buy opens investors to tremendous gains including portfolio growth. In this article, CoinGape commits to exploring 2 unique digital assets; Chainlink (LINK) and Floki.
1. Cryptocurrencies To Buy – Chainlink
With renewed buying interest among whales, the Chainlink price rebounded by 16.2% from a multi-month support zone at $12.63, reaching $14.678. This surge suggests that the LINK coin could sustain above the 38.2% Fibonacci retracement level— a healthy correction level for buyers to counterattack.

During the June correction, the Chainlink coin experienced significant outflows, with its price plummeting from $19.2 to $12.6, resulting in a 34.2% decline. The $12.6 low accompanied by a 32.8% FIB level and 100W EMA creates a high area of interest (AOI) for buyers.
In the last six months, the LINK price rebounded support times from the aforementioned support indicating the buyers are aggressively defending this level to prevent prolonged correction. The recent reversal from bottom support has propelled the LINK price to $14.5, while the market cap jumped to $8.85 Billion.
Recent on-chain data analysis from Lookonchain reveals that whales and institutions are accumulating Chainlink (LINK). Over the past seven days, 54 fresh wallets have withdrawn a total of 2.08 million LINK, valued at approximately $30.28 million, from Binance.
The support trendline on the daily chart, which has been in place since June 2023, underpins the current recovery. Buyers must maintain this level to carry a prolonged bull run.
2. Floki
According to data from CoinMarketCap, the current market cap has risen to approximately $1.66 billion, marking an increase of 2.80%. Notably, the trading volume has spiked by 47% in the past 24 hours, reaching $226 million, underscoring the increasing investor interest and market activity surrounding this cryptocurrency.

Over the last week, Floki has enjoyed a 4% increase in value. Currently, the coin fluctuates within a narrow price range of $0.00016 to $0.00018, marking a notable appreciation in its market price.
FLOKI could encounter a major obstacle if it surpasses the $0.00018 mark, with a strong resistance point at $0.0002. If it sustain above this threshold, the path could open for an upward move toward $0.0003. A continued rally might even take it to $0.0005.
On the flip side, a decline below $0.00017 might send FLOKI down to its lower support trendline at $0.00016. Further market downturns could pressure it to a support level of $0.00015. This could indicate a bearish trend for the coin.
Frequently Asked Questions (FAQs)
This is a period where cryptocurrencies other than Bitcoin rally achieving new highs and market capitalisations.
No. However, LINK has the potential to become a top 10 crypto in 2024. It currently ranks #17 on CoinGecko.
High net worth individuals are investing in the crypto market. They buy and sell tokens in large volumes often impacting prices.
Related Articles
The presented content may include the personal opinion of the author and is subject to market condition. Do your market research before investing in cryptocurrencies. The author or the publication does not hold any responsibility for your personal financial loss.
Source link
Chainlink Price Prediction: The weekends are quite stable for the cryptocurrency market as Bitcoin price is struggling hard to sustain above $64000. However, the bearish momentum is still active of several major altcoins including Chainlink projecting a continued downward trajectory. The LINK price falling for three consecutive days recorded an 8.3% loss and was dumped to $13.57. Will this correction extend if BTC plunges to the $60000 mark?
21M $LINK Unlocked from Chainlink Noncirculating Supply Contracts

Amid the current market correction, the Chainlink price shows a V-top reversal from the $19.2 mark. This first lower high formation after a notable uptrend indicates an initial sign of traders’ sentiment changing in the LINK token.
The bearish turnaround has tumbled the asset 29% down to trade at $13.62, while the market cap fell to $8.281 Billion. If the selling pressure persists, the LINK price could fall another 9-10% before hitting multi-month support of $12.26.
The support coinciding close with the 200-weekly EMA and an ascending trendline creates a strong confluence point for buyers to counterattack.
Furthermore, Chainlink has recently unlocked 21 million LINK tokens, valued at $295 million, from its noncirculating supply contracts, according to Spot On Chain. This includes:
- 18.25 million $LINK ($264 million) to Binance.
- 2.25 million $LINK ($31.3 million) to a multisig wallet.
Since August 2022, Chainlink has unlocked 127 million $LINK and sent 107.7 million $LINK to Binance, maintaining an average price of $9.89. Currently, 391.5 million $LINK tokens ($5.4 billion) remain in 24 contracts.
21M $LINK ($295M) was unlocked from @chainlink Noncirculating supply contracts ~3hrs ago, including:
• 18.25M $LINK ($264M) to #Binance
• 2.25M $LINK ($31.3M) to Multisig 0xD50fNotably:
– Chainlink has unlocked 127M $LINK and sent 107.7M $LINK to Binance at ~$9.89 since Aug… https://t.co/bVUDTMDFgZ pic.twitter.com/jxaO5Glxjb— Spot On Chain (@spotonchain) June 21, 2024
Despite these movements, the $LINK price has remained stable, indicating a well-maintained market. This suggests that the market has been able to absorb the increased supply without significant volatility, indicating a strong demand.
This increases the price potential for a bullish reversal offering a dip opportunity for sidelines traders. However, for buyers to regain better control over the asset, a breakout from the overhead trendline is needed.
The potential breakout will accelerate the buying momentum and bolster buyers to challenge the $22.8 high followed by $28.7.
However, a breakdown below the trendline will signal the continuation of the downward trend and plunge the price to $9.46.
Technical Indicator:
- Experimental Moving Average: A bearish crossover between the 20-and-200-day EMA should accelerate the selling pressure for a prolonged downfall.
- ADX: An uptick in ADX 37% indicates the sellers leading an exhausted fall will need short bounced to recuperate the selling momentum.
Related Articles
The presented content may include the personal opinion of the author and is subject to market condition. Do your market research before investing in cryptocurrencies. The author or the publication does not hold any responsibility for your personal financial loss.
Source link
24/7 Cryptocurrency News
Shiba Inu, Chainlink, Ethereum Exchange Supply Plummets, Price Recovery Ahead?
In recent developments, the top 10 exchange wallets for Shiba Inu (SHIB), Chainlink (LINK), and Ethereum (ETH) have seen a significant decrease in their holdings since May 27. Specifically, Shiba Inu’s exchange supply has shrunk by 2.4%, Chainlink by 2.9%, and Ethereum by 8.6%.
Moreover, such reductions in exchange reserves are generally interpreted as bullish indicators by traders. Hence, a potential for price recovery could be witnessed for SHIB, ETH, and LINK. Currently, all these cryptocurrencies are grappling with a downtrend.
Shiba Inu (SHIB) Price Analysis
At the time of writing, the Shiba Inu price was $0.00002175, up by 0.38% on Friday, June 14. This price movement places SHIB at a pivotal point, encountering a significant barrier at $0.000022. If Shiba Inu can surpass this resistance, it may climb to $0.000025, with the possibility of reaching $0.00003.
On the other hand, increased selling pressure could push Shiba Inu down to $0.000021, and it might fall further to $0.00002 if market sentiment deteriorates. Whilst, technical analysis indicates that SHIB might be entering a consolidation phase. The MACD indicator reveals a convergence towards the signal line, hinting at a possible slowdown or reversal in momentum.

With the MACD line currently beneath the signal line, it signifies weak bullish momentum. Currently, the Shiba Inu RSI is at 37, suggesting a neutral market stance, as SHIB is neither overbought nor oversold. However, the RSI is nearing 30, which signals a oversold condition is looming. In the aftermath of such conditions, the price generally rebounds.
Moreover, the reduction in Shiba Inu supply due to decreasing exchange reserve and frequent burns could also catalyze a rebound. On the flip side, most oscillators and moving averages on the daily chart are issuing sell signals. The 50-EMA being above the 20-EMA suggests a potential downward trend.
Also Read: Shiba Inu Coin Bull Run Ahead As SHIB Burn Rate Spikes Further
Chainlink (LINK) Outlook
Chainlink is currently trading at $15.32, down by 0.90%. This decline has triggered long liquidations, which account for over 95% of total liquidations, signaling a short-term price decline. However, the diminishing exchange reserve could lead to a rebound in the long term due to a reduced supply.
As exchange supplies decrease, it often points to accumulation by investors, which can drive prices up as supply dwindles. Moreover, the Chainlink price has sustained a profit of over 14% in the last 30 days despite the recent bearish turn. Hence, it could mirror the momentum for a reversal as the LINK open interest has also surged.
Ethereum (ETH) Prospect Following ETF Approval
According to Santiment, Ethereum’s exchange supply has seen the most significant reduction among the three cryptocurrencies, dropping by 8.6%. This substantial decrease is viewed positively by bullish traders as it may indicate strong accumulation and potential for future price increases.
Recently, Ethereum’s market narrative is also being shaped by regulatory developments. Crypto analyst Michaël van de Poppe highlighted a statement from SEC Chair Gary Gensler, suggesting that an Ethereum ETF might be listed during the summer. This anticipation signals a final correction before a substantial price surge, according to Poppe.
The approval of Spot Ethereum ETF S-1 filings is expected to have a profound impact on ETH’s price. It could potentially push the ETH price above $4,000 immediately after the ETF listing. Furthermore, Standard Chartered has projected that this development could even drive Ether’s price to exceed $8,000 by the end of the year. Such optimistic forecasts are underpinned by the expected influx of institutional investment following the ETF’s approval.
Also Read: Whale Heavily Bags SHIB, ETH, CRV, & Others, What’s Next?
The presented content may include the personal opinion of the author and is subject to market condition. Do your market research before investing in cryptocurrencies. The author or the publication does not hold any responsibility for your personal financial loss.
Source link

What’s the best new crypto in 2024?

Bitcoin Mining Difficulty Crashes 5% To Lowest Level In 3 Months, What Happens Next?
Bitcoin (BTC) Price, Volume Contrasts In Fight For Rebound

The German Government Is Selling More Bitcoin – $28 Million Moves to Exchanges
BC.GAME Announces the Partnership with Leicester City and New $BC Token!

Justin Sun Says TRON Team Designing New Gas-Free Stablecoin Transfer Solution

Mt. Gox is a ‘thorn in Bitcoin’s side,’ analyst says

XRP Eyes Recovery Amid Massive Accumulation, What’s Next?

Germany Moves Another $28 Million in Bitcoin to Bitstamp, Coinbase

'Asia's MicroStrategy' Metaplanet Buys Another ¥400 Million Worth of Bitcoin

BlackRock’s BUIDL adds over $5m in a week despite market turbulence

Binance To Delist All Spot Pairs Of These Major Crypto

German Government Sill Holds 39,826 BTC, Blockchain Data Show

HIVE Digital stock rallies over 9% as Bitcoin miner bolsters crypto reserves to 2.5k BTC

Pepe Price Analysis Reveals Bullish Strength As Bitcoin Plummets

Bitcoin Dropped Below 2017 All-Time-High but Could Sellers be Getting Exhausted? – Blockchain News, Opinion, TV and Jobs

What does the Coinbase Premium Gap Tell us about Investor Activity? – Blockchain News, Opinion, TV and Jobs
BNM DAO Token Airdrop
A String of 200 ‘Sleeping Bitcoins’ From 2010 Worth $4.27 Million Moved on Friday

NFT Sector Keeps Developing – Number of Unique Ethereum NFT Traders Surged 276% in 2022 – Blockchain News, Opinion, TV and Jobs
New Minting Services

Block News Media Live Stream

SEC’s Chairman Gensler Takes Aggressive Stance on Tokens – Blockchain News, Opinion, TV and Jobs

Friends or Enemies? – Blockchain News, Opinion, TV and Jobs

Enjoy frictionless crypto purchases with Apple Pay and Google Pay | by Jim | @blockchain | Jun, 2022

How Web3 can prevent Hollywood strikes

Block News Media Live Stream

Block News Media Live Stream
Block News Media Live Stream

XRP Explodes With 1,300% Surge In Trading Volume As crypto Exchanges Jump On Board
 Altcoins2 years ago
Bitcoin Dropped Below 2017 All-Time-High but Could Sellers be Getting Exhausted? – Blockchain News, Opinion, TV and Jobs
 Binance2 years ago
What does the Coinbase Premium Gap Tell us about Investor Activity? – Blockchain News, Opinion, TV and Jobs
- Uncategorized3 years ago
BNM DAO Token Airdrop

 Bitcoin miners2 years ago
A String of 200 ‘Sleeping Bitcoins’ From 2010 Worth $4.27 Million Moved on Friday
 BTC1 year ago
NFT Sector Keeps Developing – Number of Unique Ethereum NFT Traders Surged 276% in 2022 – Blockchain News, Opinion, TV and Jobs
- Uncategorized3 years ago
New Minting Services
 Video2 years ago
Block News Media Live Stream
 Bitcoin1 year ago
SEC’s Chairman Gensler Takes Aggressive Stance on Tokens – Blockchain News, Opinion, TV and Jobs

✓ Share: