
Altcoin
Crypto sees over $300 million in liquidations as Bitcoin, altcoins plummet


Bitcoin price broke below $61,000 on Monday as bearish pressure intensified, and the market has seen over $320 million in total liquidations in 24 hours as a result.
With bulls unable to hold key price levels as BTC traded lower, today’s dip sees buyers staring at a potential dip to the psychologically important $60,000 level.
The bloodbath is also visible across the altcoin market as Ethereum failed to hold above the $3,300 level. Meanwhile, Solana, BNB and XRP all shed significant chunks of recent gains. Uniswap and Maker, down 12% and 9% in the past 24 hours, are the biggest losers among the top 50 coins by market.
Liquidations hit over $320 million in past 24 hours
As Bitcoin slumped past $62,000 on Monday, total liquidations across the crypto market moved past $300 million.
With BTC below $61k and looking likely to extend losses, the annihilation of leveraged longs increased to over $324 million. More than $286 million are long positions, while $36 million are shorts.
According to data from Coinglass, nearly $132 million of the liquidations are for Bitcoin.
Longs account for the vast majority of the rekt traders at nearly $122 million in 24 hours while liquidated short positions account for about $9.9 million. Per the market data, over $95 million of the liquidated longs have come in the past 12 hours.
Overall, more than 85,440 traders have been liquidated in the past 24 hours. The largest single liquidation order within this period as of 12:30 pm ET on June 24 occurred on Binance – a $15.36 million burn on the BTC/USDT pair.
Why did Bitcoin price fall sharply today?
On June 24, the trustee of the bankrupt crypto exchange Mt. Gox announced that the long-awaited repayments for creditors will start in July. With over $9 billion in BTC with the defunct exchange and earmarked for distribution, investor reaction to the news was swift and biting.
Bitcoin price tumbled more than 5% after the news, breaking past support levels as fears of a potential sell-off pressure struck the market. The downward pressure also comes amid recent selling by a wallet linked to the German government.
Earlier this year, German police seized close to 50,000 BTC worth around $2.1 billion at the time.
Bitcoin’s gains over the past months meant the total value of the coins reached over $3 billion. But data from Arkham Intelligence shows the wallet has recently sold off a significant number of BTC, likely contributing to the selling.
Miners have also sold quite a chunk, with IntoTheBlock data showing about 30,000 BTC sold post-halving.
Source link


Akash Network (AKT) price was up 12% on Thursday as the cryptocurrency ranked second behind Book of Meme (BOME) as the top gainers.
While BOME leads top 100 gainers by market cap with a 24-hour gain of over 14%, AKT traded to highs of $3.45. The AI related token led other coins in this category, with only Render (RNDR) and The Graph (GRT) in the green among top AI and Big Data cryptocurrencies.
SingularityNET, Fetch.ai and Ocean Protocol, which are headed for a merger under the Artificial Superintelligence Alliance (ASI), were all dumping more than 10% at the time of writing.
The all-time high for AKT was $8.07 reached in April 2021.
However, while in the current market cycle, the cryptocurrency peaked at $6.22 on March 10, 2024. A surge amid Upbit listing in April saw AKT break to above $6.03 before paring gains.
Akash Network price up amid RenAIssance Hackathon
The broader crypto market was up just 1% to about $2.29 trillion, but Akash Network appeared to defy this with its double-digit gain.
As well as the announcement that Crypto.com now supports AKT staking with up to 19% in rewards, positive vibes around Akash Network may have come from another major network related event.
On June 25, the Akash team revealed a collaboration with Flock, a platform for decentralized training of AI models.
With FLock.io, AKT holders can participate in an open and collaborative ecosystem, contributing to training of models, for on-chain rewards. Users can also contribute data and other computing resources to earn AKT.
The RenAIssance Hackathon offers rewards in AKT, USDC and native FLock token FML. Top 3 models in the hackathon will earn 400 USDC and $400 worth of AKT for the winner; 300 USDC plus $300 worth of AKT will go to the runner up and 200 USDC plus $200 in AKT for the third-place model.
Participants also stand to win 200 USDC and $200 worth of AKT for winning validators.
Source link
Ethereum price is at an important juncture with support at $3,400 tested and recovery above $3,600 ongoing. Bitcoin too is starting to shape the next crypto landscape this week after reclaiming ground above $65,500. With the two largest cryptocurrencies modestly in the green, investors are beginning to appreciate the sell-off as a blessing in disguise. This means they can apply key dollar cost averaging practices, buy the dips, and eventually increase potential gains in the second half of the year.
Factors Likely To Drive The Next Altcoin Season
The crypto fear and greed index has fallen to 64—still showing greed among investors but significantly below last week’s figure of 74. This indicator by Alternative, monitors market sentiment with zero on the scale referring to extreme fear and 100 to extreme greed.
Since markets function as living entities, sentiment is driven by people. As euphoria increases, investors become greedy due to the FOMO. This propels prices higher but also introduces the risk of a drastic decline as some investors decide to take profits. It is rarely a good idea to buy when the crypto fear and greed index is near the extreme top.
On the other side of the fence, a drop in the metrics suggests greed is creeping in. Because sentiment is falling, many people choose to sell—some due to the fear of losing their capital or possibly to protect unrealized gains.
It is advisable to buy when the market is red and sell when it is green. With that in mind, investors might consider this to be a good time to buy into their favorite altcoins, ignoring the drop in the fear and greed index to 64.
Ethereum price has increased 1.3% in 24 hours to $3,585 on Thursday. The value growth, although minor, has reflected a 0.81% surge in the market cap to $438 billion. However, the second-largest digital asset faces a 30% slide in the trading volume to $14 billion—a factor likely to hamper potential growth in the upcoming sessions.
Nevertheless, investors seem to have set their sight on the approvable of the spot ETF. The Securities and Exchange Commission (SEC) approved the listing of spot Ethereum ETFs in May pending further approval for the operators of the products which will eventually give way to actual trading on stock exchanges.
The SEC also dropped investigations into Ethereum, further clearing doubts that Ether could be considered a security.
ETF analyst Eric Balchunas predicted earlier this week that Ethereum ETFs could start trading on July 2. This followed word that the SEC “sent issuers comments on S-1s today, and they’re pretty light, nothing major, asking for them back in a week.”
UPDATE: we are moving up our over/under date for the launch of spot Ether ETF to July 2nd, hearing the Staff sent issuers comments on S-1s today, and they’re pretty light, nothing major, asking for them back in a week. Decent chance they work to declare them effective the next… https://t.co/XJZ8JLwEFF
— Eric Balchunas (@EricBalchunas) June 14, 2024
The start of the actual trading of Ethereum ETFs could spark fresh interest in ETH and altcoins. Traditional investors would find it easier to buy ETH via exchanges, validating the crypto market.
Analysts at CoinGape expect this to be a moment of reckoning for altcoins like Solana, XRP, and Dogecoin which are believed to be the next in line for spot ETFs.
The move could be bullish for the entire crypto market, including Bitcoin, and possibly usher in the much-anticipated altcoin season.
Ethereum Price Stares At A 30% Breakout
Ethereum price is making key strides in its recovery following the correction to $3,400. The token currently sits above two exponential moving averages (EMAs), the 20-day and the 50-day.
A daily close above $3,600 resistance would mean that bulls are getting back in the game for a breakout past $4,000. The presence of an inverse head and shoulders (H&S) pattern on the daily chart could reinforce the bullish grip when validated.

This is a bullish pattern validated when the price breaches the neckline resistance around $3,800 in Ethereum price prediction case. Traders would enter above this resistance eyeing a 30% move close to $5,000.
Related Articles
The presented content may include the personal opinion of the author and is subject to market condition. Do your market research before investing in cryptocurrencies. The author or the publication does not hold any responsibility for your personal financial loss.
Source link
Despite its recent decline, XRP, one of the largest cryptocurrencies by market cap, now holds the potential for substantial gains. Particularly, according to a recent technical analysis by Amonyx, XRP is poised for a bullish run against both the United States dollar and Bitcoin throughout 2024.
This optimism is grounded in several key technical indicators and historical price actions, suggesting that XRP might soon experience notable price movements.
Technical Forecast: XRP Path In 2024
Amonyx’s technical assessment focuses on the long-term price trends of XRP, particularly its performance within an ascending channel established in 2014. The XRP/USD pair analysis points to consistent behavior within this channel, bounded by its upper and lower trendlines.
Key Fibonacci retracement levels identified at 0.618, 0.786, 1.618, and 2.618 are seen as potential resistance and support zones. The analysis highlights these zones as pivotal areas where price reversals or consolidation might occur.
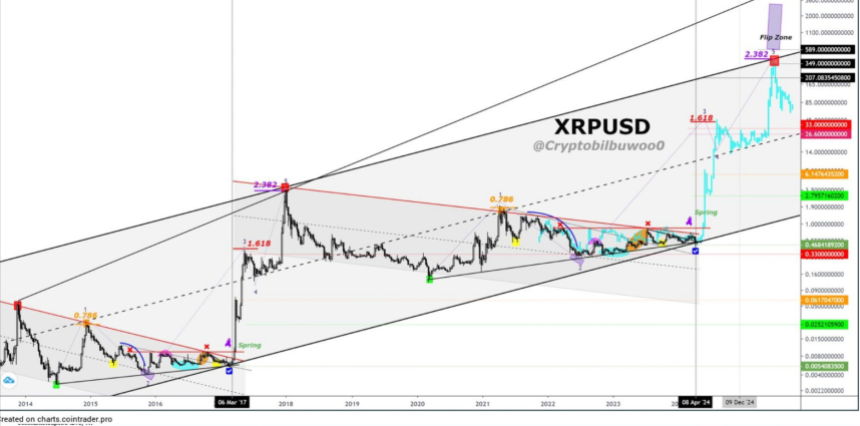
Moreover, the analyst projects a bullish surge toward the 2.618 Fibonacci level by 2024, suggesting that investors might witness a significant uptick in XRP’s value.
This ‘flip zone’ the analyst wrote on the chart at the upper end of the trend provides a theoretical point for the asset to consolidate or reverse, indicating critical trading opportunities.
Turning to the XRP/BTC chart, a similar detailed examination reveals a persistent descending trendline starting from the same base year, 2014.
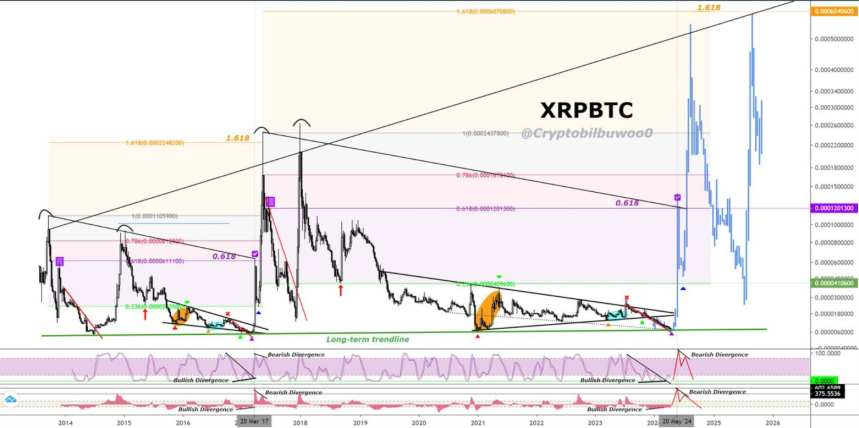
This trendline has been a resistance point for XRP, with the price nearing another test of this boundary. The analysis includes observations of bullish and bearish divergences on momentum indicators such as the Relative Strength Index (RSI), suggesting potential for upcoming price movements.
The projected path on the XRP/BTC chart envisions a bullish trajectory for the 1.618 Fibonacci level, corroborating the bullish sentiments from the XRP/USD analysis.
This convergence in analysis across different currency pairs further strengthens the case for XRP’s growth potential relative to both the dollar and Bitcoin.
Current Market Position and Outlook
Despite these optimistic projections, XRP’s price currently trades at $0.49, having recovered slightly by 1% after a nearly 10% decline over the past two weeks.
This recovery could be the onset of the anticipated bullish trend. Insights from CryptoQuant highlight an increase in XRP’s Open Interest (OI), particularly following developments related to regulatory news involving the SEC. This surge in OI indicates a growing interest from traders, aligning with the expected price increase.

Meanwhile, Santiment has recently suggested that XRP’s current market conditions and a 30-day Market Value to Realized Value (MVRV) ratio of -3.5% place it in a mildly bullish category.
The lower a cryptocurrency’s 30-day MVRV is, the higher the likelihood we see a short-term bounce:
Bitcoin: -4.0% (Mild Bullish)
Ethereum: -4.3% (Mild Bullish)
XRP: -3.5% (Mild Bullish)
Dogecoin: -16.7% (Very Bullish)
Toncoin: -0.6% (Neutral)
Cardano: -12.6% (Very Bullish) pic.twitter.com/zHGg4t3qo1— Santiment (@santimentfeed) June 19, 2024
Featured image created with DALL-E, Chart from TradingView
Source link

Taliban jailed 8 traders for holding and using crypto

Solana Struggles to Rise Amid Bitcoin Price Uncertainty

Developing in Web 3.0 Is on the Cusp of a Breakthrough

Digital Shovel Sues RK Mission Critical for Patent Infringement on Bitcoin Mining Containers

crypto will get positive regulation ‘no matter who wins’ election

Toncoin (TON) v Cardano (ADA): On-chain Data Show Gains

Crypto Markets Like Their Odds With Kamala Harris

How Financial Surveillance Threatens Our Democracies: Part 2

CleanSpark’s amped hashrate mined 445 Bitcoin in June

Ripple and Coinbase Use Binance Win to Contest SEC Claims

DCG, Top Executives Renew Push to Get New York AG’s Civil Fraud Suit Dropped

Introducing Satoshi Summer Camp: A Bitcoin Adventure for Families

US judge approves expedited schedule for Consensys suit against SEC

2 Cryptocurrencies To Buy Boosting Into Top 10

Bitcoin Miners Slow Down Selling In July, What This Could Mean For Price

Bitcoin Dropped Below 2017 All-Time-High but Could Sellers be Getting Exhausted? – Blockchain News, Opinion, TV and Jobs

What does the Coinbase Premium Gap Tell us about Investor Activity? – Blockchain News, Opinion, TV and Jobs
BNM DAO Token Airdrop

NFT Sector Keeps Developing – Number of Unique Ethereum NFT Traders Surged 276% in 2022 – Blockchain News, Opinion, TV and Jobs
A String of 200 ‘Sleeping Bitcoins’ From 2010 Worth $4.27 Million Moved on Friday
New Minting Services

Block News Media Live Stream

SEC’s Chairman Gensler Takes Aggressive Stance on Tokens – Blockchain News, Opinion, TV and Jobs

Friends or Enemies? – Blockchain News, Opinion, TV and Jobs

Enjoy frictionless crypto purchases with Apple Pay and Google Pay | by Jim | @blockchain | Jun, 2022

How Web3 can prevent Hollywood strikes

Block News Media Live Stream

Block News Media Live Stream

XRP Explodes With 1,300% Surge In Trading Volume As crypto Exchanges Jump On Board
Block News Media Live Stream
 Altcoins2 years ago
Bitcoin Dropped Below 2017 All-Time-High but Could Sellers be Getting Exhausted? – Blockchain News, Opinion, TV and Jobs
 Binance2 years ago
What does the Coinbase Premium Gap Tell us about Investor Activity? – Blockchain News, Opinion, TV and Jobs
- Uncategorized3 years ago
BNM DAO Token Airdrop
 BTC1 year ago
NFT Sector Keeps Developing – Number of Unique Ethereum NFT Traders Surged 276% in 2022 – Blockchain News, Opinion, TV and Jobs

 Bitcoin miners2 years ago
A String of 200 ‘Sleeping Bitcoins’ From 2010 Worth $4.27 Million Moved on Friday
- Uncategorized3 years ago
New Minting Services
 Video2 years ago
Block News Media Live Stream
 Bitcoin1 year ago
SEC’s Chairman Gensler Takes Aggressive Stance on Tokens – Blockchain News, Opinion, TV and Jobs

✓ Share: