
ETH
Ethereum Key Indicators Suggest A Sharp Drop Below $1K
Ethereum declined below the $1,120 support against the US Dollar. ETH is now at a risk of more losses if it stays below the key $1,150 resistance.
- Ethereum remained in a bearish zone below $1,200 and $1,150 levels.
- The price is now trading below $1,150 and the 100 hourly simple moving average.
- There is a key bearish trend line forming with resistance near $1,100 on the hourly chart of ETH/USD (data feed via Kraken).
- The pair could decline further if there is a clear move below the $1,050 support zone.
Ethereum Price Turns Red
Ethereum remained in a bearish zone and extended losses below the $1,150 support zone. ETH failed to stay above the $1,120 support zone and moved further into a bearish zone.
The price even settled below the $1,000 support zone and tested the $1,075 zone. A low is formed near $1,076 and the price is now consolidating losses. It is trading well below $1,150 and the 100 hourly simple moving average.
An immediate resistance on the upside is near the $1,100 level. There is also a key bearish trend line forming with resistance near $1,100 on the hourly chart of ETH/USD. The trend line is near the 23.6% Fib retracement level of the downward move from the $1,235 swing high to $1,076 low.
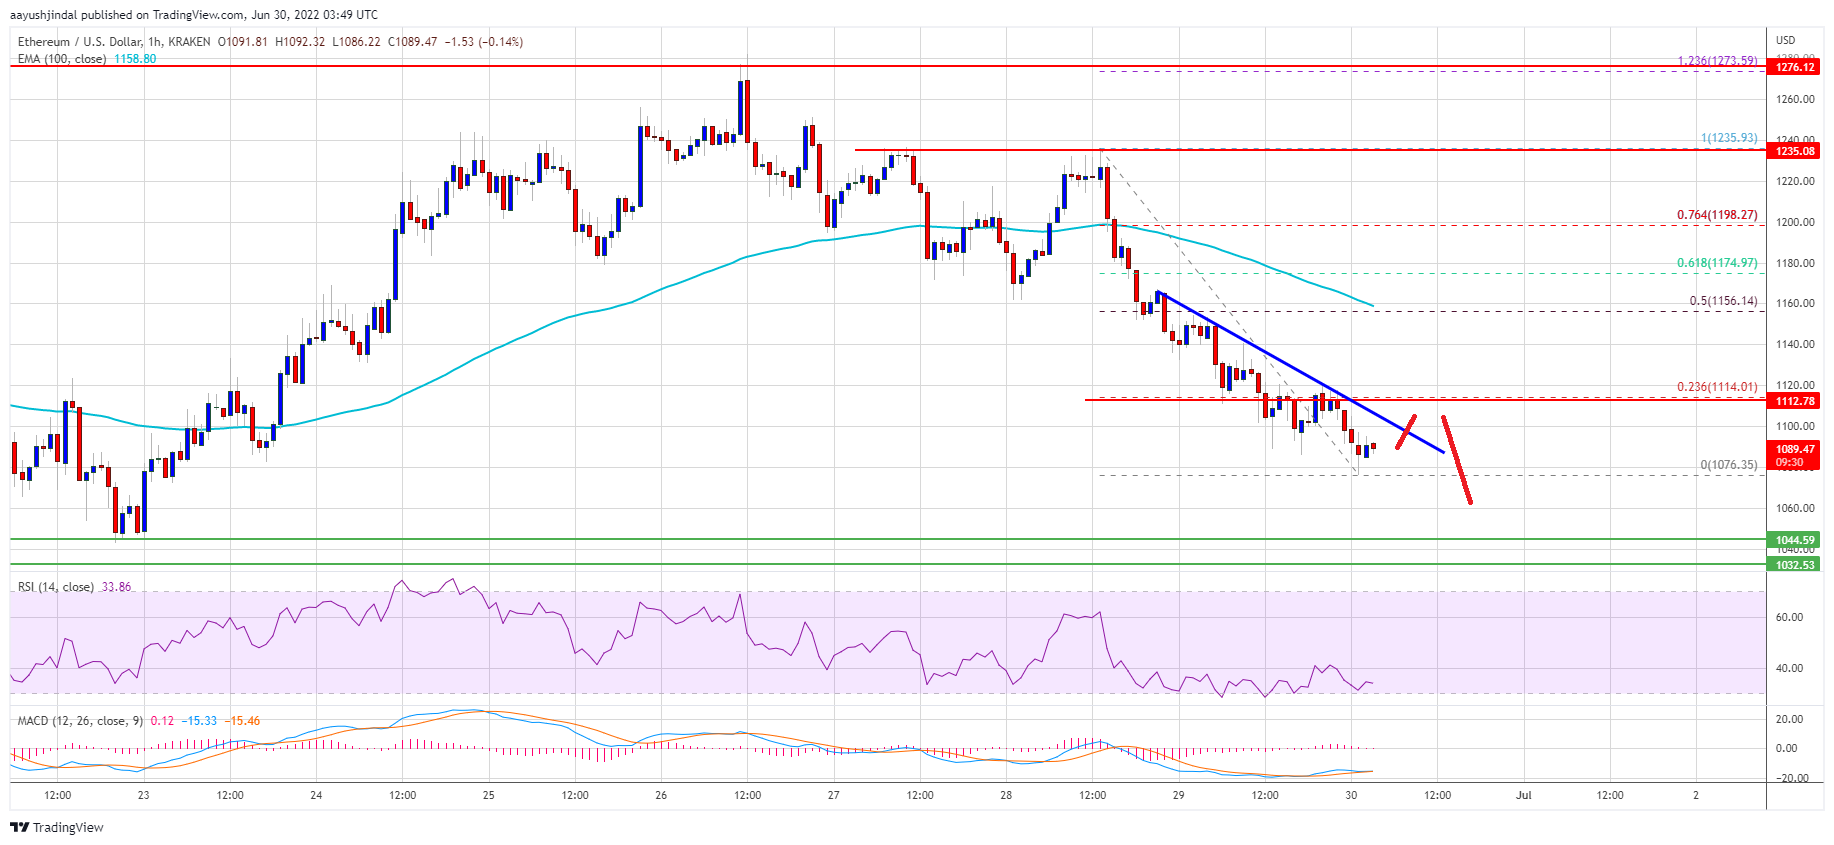
Source: ETHUSD on TradingView.com
The next major resistance is near the $1,150 zone. The 50% Fib retracement level of the downward move from the $1,235 swing high to $1,076 low is also near $1,150. A close above the $1,150 resistance zone could start a steady increase. In the stated case, the price could clear the $1,200 resistance. Any more gains might send the price towards the $1,235 high.
More Losses in ETH?
If ethereum fails to rise above the $1,150 resistance, it could continue to move down. An initial support on the downside is near the $1,075 zone.
The next major support is near the $1,050 zone. A close below the $1,050 level might push ether price further lower. In the stated case, ether price may perhaps decline towards the $1,000 level.
Technical Indicators
Hourly MACD – The MACD for ETH/USD is now gaining momentum in the bearish zone.
Hourly RSI – The RSI for ETH/USD is now well below the 50 level.
Major Support Level – $1,050
Major Resistance Level – $1,150
Source link


Ethereum started another decline below $1,200 against the US Dollar. ETH could decline heavily if there is a close below $1,150.
- Ethereum failed to clear the $1,280 resistance zone and declined below $1,200.
- The price is now trading below $1,200 and the 100 hourly simple moving average.
- There is a major bearish trend line forming with resistance near $1,180 on the hourly chart of ETH/USD (data feed via Kraken).
- The pair could continue to decline if there is a close below the $1,150 level.
Ethereum Price Takes A Hit
Ethereum attempted an upside break above the $1,275 resistance zone. However, ETH failed to extend gains and started a fresh decline below the $1,220 level.
There was a clear move below the $1,200 level and the 100 hourly simple moving average. Ether price traded below the 50% Fib retracement level of the upward move from the $1,076 swing low to $1,276 high. It is now struggling to stay above the $1,150 support zone.
The price is consolidating near the 61.8% Fib retracement level of the upward move from the $1,076 swing low to $1,276 high. There is also a major bearish trend line forming with resistance near $1,180 on the hourly chart of ETH/USD.
An immediate resistance on the upside is near the $1,175 level. The next major resistance is near the trend line zone and $1,180, above which the price may perhaps rise towards $1,220.
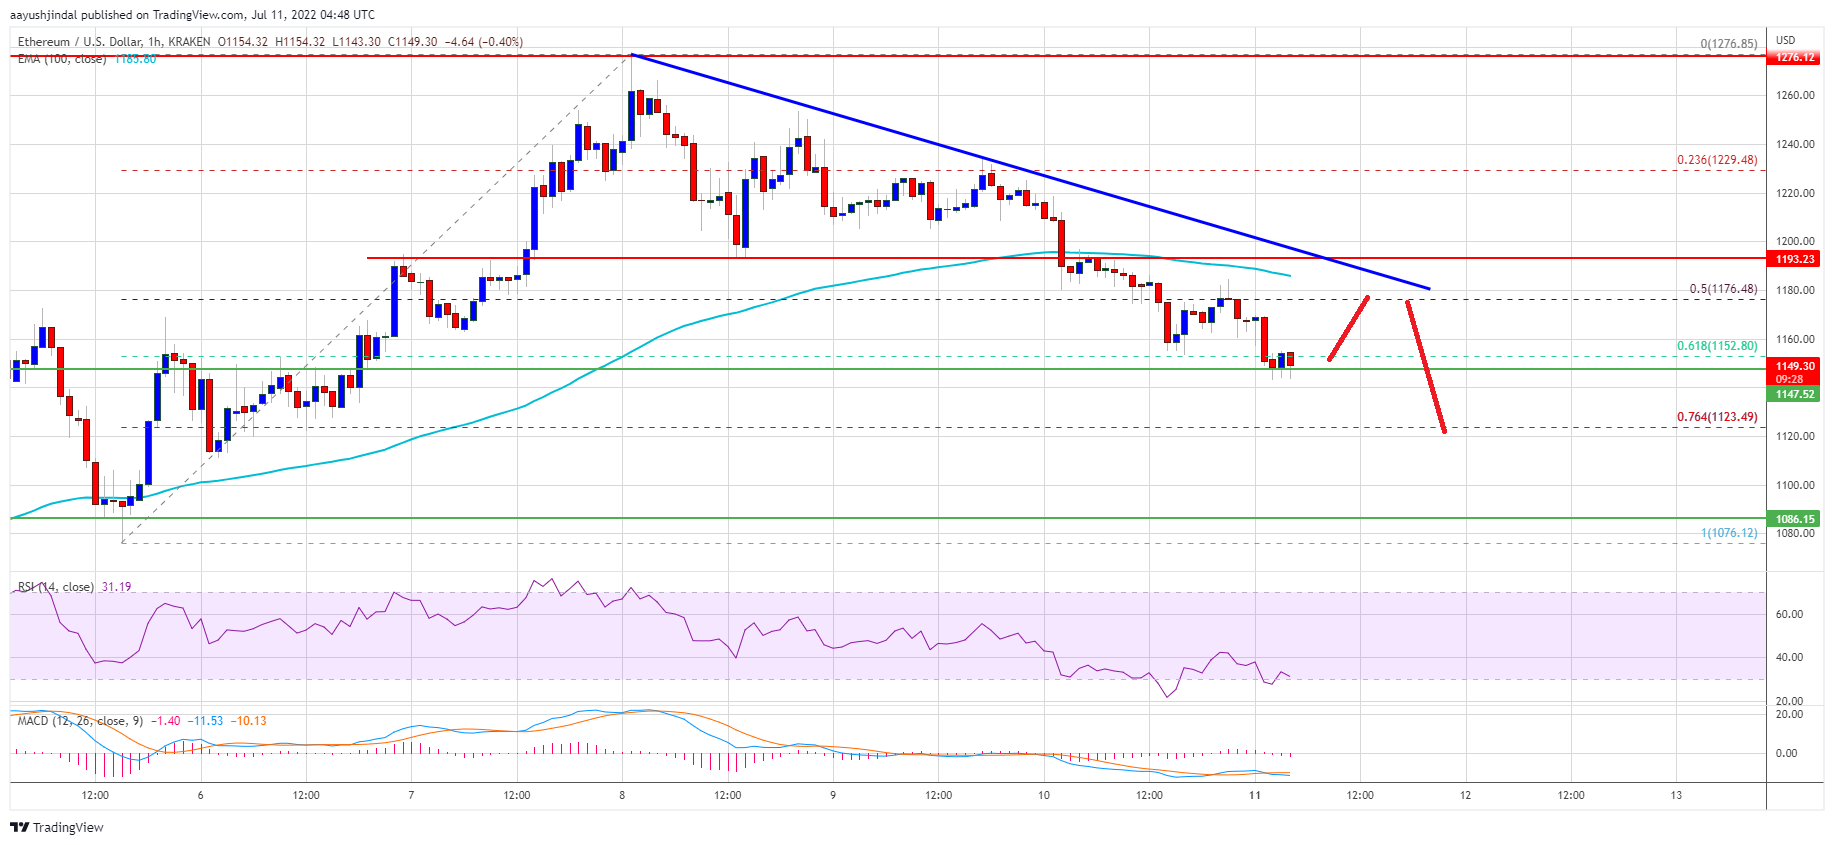
Source: ETHUSD on TradingView.com
The key barrier is still near the $1,280 level, above which the price could gain strength. In the stated case, the price could rise towards the $1,350 resistance zone.
More Losses in ETH?
If ethereum fails to rise above the $1,180 resistance, it could continue to move down. An initial support on the downside is near the $1,123 zone. The next major support is near the $1,080 zone.
A downside break below the $1,080 support may perhaps send the price further lower. In the stated case, the price may perhaps decline toward the $1,020 level. If the price fails to stay above the $1,020 or $1,000, it could even slide towards the $950 level.
Technical Indicators
Hourly MACD – The MACD for ETH/USD is now gaining momentum in the bearish zone.
Hourly RSI – The RSI for ETH/USD is now well below the 50 level.
Major Support Level – $1,125
Major Resistance Level – $1,180
Source link
Jul 8, 2022 09:47 UTC
| Updated:
Jul 8, 2022 at 09:47 UTC
The social media and discussion web site Reddit has declared the launch of blockchain-backed collectible avatars. The collectible avatars are kept via the Polygon blockchain because the chain was chosen for its “low-cost transactions and property commitments.”
Reddit’s Polygon-Backed Digital Avatars can Presently Be on the market to the General Public
On July 7, 2022, the workers at Reddit declared the launch of blockchain-backed Reddit avatars that are kept on the Polygon figure network. It’s not Reddit’s 1st rodeo with blockchain technology because the social media and discussion platform was operating with Arbitrum’s layer 2 (L2) technology with ETH-based community purpose tokens in July 2021. the subsequent October, Reddit was seeking a senior engineer for a platform that options “NFT-backed digital product.” In Jan 2022, it had been reported that Reddit was allegedly testing NFT profile pic functions.
The new Polygon-issued collectible avatars are on the market for purchase and therefore the artists who created them can receive royalties. The acquisition provides the owner rights to the art on and off the platform, Reddit’s announcement details. “You don’t want cryptocurrency to buy these avatars, nor are they being placed up for auction,” Reddit explained on Thursday. “Each avatar has been priced at a hard and fast quantity and is purchasable with act (government-issued) currencies.”
“In this series, Collectible Avatars are limited-edition avatars created by freelance artists, in partnership with Reddit, and supply house owners with distinctive edges on the Reddit platform,” the company’s journal post says. “If somebody sets their Collectible Avatar as their avatar on Reddit, they will mix-and-match the avatar gear with alternative Reddit avatar gear and accessories, and their profile image in comments sections can have a glow-like impact.”
Reddit ads:
Blockchain-backed Collectible Avatars are one amongst the first steps we’re taking to check out the potential edges of this idea on Reddit.
R/collectibleavatars Subscribers will Get Early Access, NFTs keep in Reddit’s Vault Wallets
Reddit’s new Polygon figure NFT avatars are going to be on the market to the general public within the “coming weeks’ ‘ however the corporation is on the lookout for early access redditors to hitch the r/collectibleavatars community. “In that community, folks will learn a lot concerning a way to purchase Collectible Avatars, find wallets to store them, and find to understand our artists with covert posts, AMAs, and more,” Reddit’s journal post notes.
Additionally, Reddit elaborated that the avatar NFTs are going to be kept within the Reddit-produced billfold referred to as Vault, that is wherever community points are kept moreover. Vault works with Ethereum-compatible blockchains like two-dimensional figures. whereas a number of the artists that contributed to Reddit’s blockchain-backed collectible avatars were found in numerous subreddits, some artists participated during a Reddit-related art project for the primary time.
“Many of the artists we tend to work with for this 1st series came from well-liked inventive communities like r/comics,” Reddit ended. “Some have cultivated the abilities they used for this program in subreddits like r/procreate or r/adobeillustrator. we tend to conjointly worked with artists from our networks who are delivery their work to Reddit for the primary time.”
Clark
Head of the technology.
Source link

Leverage Ratio Is Still Very High

Voyager can’t guarantee all customers will receive their crypto under proposed recovery plan

The Critical Role Of Real-World Assets In The Future Of DeFi

G20 regulator to present global crypto rules in October 2022

Why Peter Brandt Thinks Cardano Is The Definition Of “Ugly”

US crypto regulation bill aims to bring greater clarity to DAOs

Crypto Community Remains Upbeat On XRP, Despite Bearish Market Conditions

Binance ban off the cards, says Philippine trade and industry department

This Messaging App Lets You Pay With Crypto

NEOPIN signs strategic partnership with Cube Entertainment – Blockchain News, Opinion, TV and Jobs

Crypto needs regulation to mitigate risks, says Bank of England exec

Grayscale legal officer says Bitcoin ETF litigation could take two years

Quant (QNT) Registers Gains In Past Days

US inflation data will be 'messy' — 5 things to know in Bitcoin this week

Ethereum Revisits Key Support, Can The Bulls Protect More Losses
BNM DAO Token Airdrop
New Minting Services

Could an Earnings Recession Lead to More Pain for Crypto? – Blockchain News, Opinion, TV and Jobs

‘Crypto is just like the end of the 90s with the internet bubble,’ says Hodl CEO Maurice Mureau

Virginia passes new crypto law whilst macro headwinds mount up – Blockchain News, Opinion, TV and Jobs

Interview with Ruud Feltkamp, Owner of AI-driven Trading Bot Cryptohopper – Blockchain News, Opinion, TV and Jobs

A Bear of Historic Proportions – Blockchain News, Opinion, TV and Jobs

High-profile BAYC collector denies allegations of wrongdoing brought by DeFi detective

Tesla, Blockstream and Jack Dorsey’s Block Team-up to Mine Bitcoin Sustainably – Blockchain News, Opinion, TV and Jobs

BNM Live Stream

Are expiring copyrights the next goldmine for NFTs?

Block News Media Live Stream

Fintech-Ideas brings blockchain functionality to its range of platforms – Blockchain News, Opinion, TV and Jobs

Live Stream Block News Media

Leading Crypto Exchanges See Negative Funding Rates, Have The Bears Taken Over?
-
Uncategorized6 months ago
BNM DAO Token Airdrop
-
Uncategorized8 months ago
New Minting Services
-
 bear market2 weeks ago
Could an Earnings Recession Lead to More Pain for Crypto? – Blockchain News, Opinion, TV and Jobs
-
 Blockchain2 weeks ago
‘Crypto is just like the end of the 90s with the internet bubble,’ says Hodl CEO Maurice Mureau
-
 Bitcoin2 weeks ago
Virginia passes new crypto law whilst macro headwinds mount up – Blockchain News, Opinion, TV and Jobs
-
 Blockchain2 weeks ago
Interview with Ruud Feltkamp, Owner of AI-driven Trading Bot Cryptohopper – Blockchain News, Opinion, TV and Jobs
-
 bear markets2 weeks ago
A Bear of Historic Proportions – Blockchain News, Opinion, TV and Jobs
-
 Blockchain Analytics2 weeks ago
High-profile BAYC collector denies allegations of wrongdoing brought by DeFi detective