
bear market
Ethereum Needs To Breach This Level To Sustain Bullish Pace
Despite attempts by bears to drive prices down, Ethereum (ETH) managed to hold its head above water on Wednesday, topping $1,200 for the most of the session.
Coingecko records indicate that as the time of writing, ETH is trading at $1,129.50, a decrease of 0.5% over the past week and still slightly down from the previous day’s high of $1,228.88.
Even though the ETH/USD pair fell to an intraday low of $1,170.23 during Tuesday’s session, bulls were able to keep prices above this area.
The market has been dominated by bulls for the past few days. A 40 percent increase in 10 days can undoubtedly be read constructively, but it is essential to consider all possible outcomes.
According to the chart, ETH is currently trapped below the resistance zone on the daily time frame.
Ethereum Rally Seen If $1,500 Barrier Is Breached
This area, which extends from $1,300 to $1,500 (in red), was anticipated to provide substantial support during the severe decline early this month, but clearly failed to do so. Now, it serves as a solid barrier.
With this mechanism in place, a relief rally is likely to begin if buyers can push the price over the $1,500 horizontal barrier. Then, the possibility of staging a rally is revived.
Suggested Reading | Sandbox (SAND) Blows Up 20% Over Last 24 Hours Following ‘Takeover’ Rumors
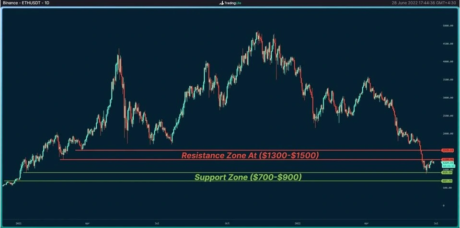
Source: TradingView.com
In the coming months, Ethereum is anticipated to succeed. Numerous improvements on the Ethereum chain will catapult ETH out of its current slumber. Nevertheless, the efficacy will depend on the conduct of Ethereum holders in the coming weeks.
Next ETH Handle Could Be $1,730
In the next bear run, the price of ETH might fall to $750 if bears maintain their tight grip on the market. Consequently, if inflation keeps going up, the cryptocurrency may decline further. However, if the bulls take the driver’s seat, the next ETH handle will be $1,730.
Recent movement has pushed the price of Ether up by as much as 8 percent in the past week, resulting in the 10-day moving average displaying indications of potential higher gains.
Suggested Reading | Ethereum (ETH) Hammered Down To $950 As Crypto Selloff Deepens
ETH total market cap at $137.5 billion on the daily chart | Source: TradingView.com
If this short-term trend maintains its current course, market observers should notice a cross to the upside.
This may be the impetus that propels the price of the world’s second-biggest cryptocurrency back above $1,400.
The cryptocurrency market, which has recently mirrored the stock market, has fallen victim to the larger market sell-off of risky assets.
However, as a result of the advancements that the Ethereum team is implementing, especially Ethereum 2.0, the ETH price is anticipated to increase this year.
Featured image CoinMarketDo, chart from TradingView.com
Source link


The Loopring (LRC) price has entered a symmetrical triangle pattern on the daily chart in the face of continuous bearish pressure.
This indicates that the bulls are retreating, so LRC must attract buyers to achieve a successful breakout.
However, a bearish breakthrough is anticipated, and the token price may fall below the important support at $0.30. Loopring is trading at $0.37 as of this writing, a decrease of 4% over the last seven days, according to statistics provided by Coingecko on Wednesday.
The whole crypto market began the year on a positive note. However, by the end of January, it had already begun to indicate that 2022 would be quite bumpy.
Image - FX Empire
Suggested Reading | Ethereum (ETH) Continues To Lose Luster, Drops Below $1,100 Support
Loopring Dragged Down By Gloomy Market
Today, the entire crypto market is aggressively negative, having seen a mini-crash in both the months of May and June.
The present strong aggressive bearish trend of the sector has also affected other cryptocurrencies, such as Loopring, which is down 80% year-to-date. The coin’s trading volume is 69 million, while its market capitalization is 488 million.
Loopring has fluctuated in a descending triangle pattern during the course of the past two months. In addition, LRC has retested the falling trendline, which could ignite another bear cycle inside this pattern.
Loopring was one of the few projects in June that had begun to exhibit indications of recovery. The first five days of the project were marked by a significant bullish push. However, this was followed by a significant bearish movement that led to a 41 percent price collapse.
LRC total market cap at $494 million on the daily chart | Source: TradingView.com
LRC Faces Tough Road Ahead
The first 15 days of June also began to improve, resulting in the reversal of some of the month’s losses because of a nearly 40 percent price increase. In contrast, Loopring appears to have continued its strong bearish trend over the past week, shedding 14 percent of its value.
Meanwhile, the same forces affecting other markets, such as stocks, play a significant role in the current downturn. Consumer prices are increasing at the highest annual rate in more than 40 years, and the latest Federal Reserve rate increase is still being felt on the bitcoin market.
Forecasts of an even more challenging economic climate are also causing the price of Loopring and other altcoins to continue to decrease.
Suggested Reading | Tezos (XTZ) Nears 3-Week High – Can Bulls Barrel Towards $1.80?
Featured image from CHVNRadio, chart from TradingView.com
Source link
The crypto community got a major surprise two years ago when a leading provider of crypto solutions for businesses was slapped with a lawsuit by the U.S. Securities and Exchange Commission.
Ripple was taken to court by the SEC, which sparked what has become the most closely watched legal showdown in the cryptocurrency industry.
The SEC’s lawsuit accusing Ripple of breaking securities laws has devolved into a lengthy legal dispute, with the future of cryptocurrency regulation potentially at risk.
The case, which was filed in December 2020, revolves around the Commission’s claim that Ripple refused to register approximately $1.4 billion worth of XRP, its native coin, as securities.
Suggested Reading | Quant (QNT) Registers Gains In Past Days – A Short-Term Upswing In Place?

Image: MetaCrunch
Crypto Community Remains Upbeat About XRP
Despite the current Ripple legal dispute and unfavorable market conditions, the XRP community continues to be optimistic about the XRP price as this development unfolds.
Six months following the filing of the SEC’s litigation against Ripple and its executives, the price of XRP plummeted from $0.7 to $0.2. As the case progressed, though, the value of Ripple rose along with it.
Monday’s Coingecko stats show that XRP is trading at $0.327, a 1.5 percent increase over the previous week. The 24-hour trading volume for XRP is $1,116,622,856.
Can XRP Hit $35,000? Or, $50K Even?
Notable crypto industry figures, such as Valhil Capital CEO Jimmy Vallee, estimate that the price of XRP might hit $35,000. Others are of the opinion that the price may surpass $50,000.
The growth of XRPL use cases has also contributed to the excitement around XRP. Peersyst Technology has announced the creation of the first Colombian National Land Registry on the XRPL blockchain.
During the current bear market, XRP is one of the cryptocurrency investors are anticipating a robust run for.
As a result of the increased interest in Central Bank Digital Currency (CBDC), Ripple has prepared itself to be recognized through the private ledgers and inexpensive cross-border transfers it enables via its project Ripplenet, consequently boosting the price and sentiment of XRP.
In other developments, the largest bank in Morocco, Attijariwafa Bank, has partnered with the company to promote seamless XRP token payments for its customers.
XRP total market cap at $16 billion on the daily chart | Source: TradingView.com
Hold On Long Positions, Or Take Profits?
Meanwhile, interested parties can open long positions and anticipate that, if they are successful, the price of XRP will rise over $0.387 and sweep the liquidity first.
Market participants have two options when the first goal is hit: they may either stick onto their positions for the retest of the next level at $0.439 or book profits.
Suggested Reading | Dogecoin (DOGE) Seen Jumping This Month, Despite Twitter-Musk Deal Collapse
XRP has recovered from the crisis in December 2020, and the long-term price forecast for this year is optimistic. This year, the cryptocurrency is likely to surpass its current all-time high of approximately $3.84, analysts say.
However, this will only occur if it overcomes the numerous psychological barriers it has erected over the years.
Featured image from The Positivity Blog, chart from TradingView.com
Source link

China’s central bank to expand deployment of e-CNY

Negative CPI Report Causes Bitcoin Market Cap To Lose $15 Billion In 10 Minutes

This oracle data provider platform has surpassed 4 million nodes since inception

Exchange Whale Ratio Is Trending Up

Why Alex Tapscott quit his high-paying job to write a book about Bitcoin

Bears Refuse To Budge As Bitcoin Struggles To Reclaim $20,000

Fighting the crypto winter and token protocol inflation in 2022

Social Dominance Rate Of Bitcoin Marks An All-Time High in 2022

NFT volume sees yearly low in June, but first-time buyers remain consistent

Crypto Wallets, Explained. What is a crypto wallet? | by Blockchain.com | @blockchain | Jul, 2022

With Revulution NFTs, Revuto Offers Lifetime Access To Netflix & Spotify And Reinvents How Subscriptions Are Managed

Dogecoin misses bullish target after Elon Musk snubs Twitter — what’s next for DOGE price?

Loopring Wobbles In Last 2 Months

Crypto winter presents an opportunity amid chaos, says asset group exec

Ethereum (ETH) Continues To Lose Luster, Drops Below $1,100 Support
BNM DAO Token Airdrop
New Minting Services

Could an Earnings Recession Lead to More Pain for Crypto? – Blockchain News, Opinion, TV and Jobs

A Bear of Historic Proportions – Blockchain News, Opinion, TV and Jobs

Virginia passes new crypto law whilst macro headwinds mount up – Blockchain News, Opinion, TV and Jobs

‘Crypto is just like the end of the 90s with the internet bubble,’ says Hodl CEO Maurice Mureau

Interview with Ruud Feltkamp, Owner of AI-driven Trading Bot Cryptohopper – Blockchain News, Opinion, TV and Jobs

Are expiring copyrights the next goldmine for NFTs?

High-profile BAYC collector denies allegations of wrongdoing brought by DeFi detective

BNM Live Stream

Dollar Strength Causes Bitcoin Weakness – Blockchain News, Opinion, TV and Jobs

Live Stream Block News Media

Block News Media Live Stream

Tesla, Blockstream and Jack Dorsey’s Block Team-up to Mine Bitcoin Sustainably – Blockchain News, Opinion, TV and Jobs

Fintech-Ideas brings blockchain functionality to its range of platforms – Blockchain News, Opinion, TV and Jobs
-
Uncategorized7 months ago
BNM DAO Token Airdrop
-
Uncategorized8 months ago
New Minting Services
-
 bear market2 weeks ago
Could an Earnings Recession Lead to More Pain for Crypto? – Blockchain News, Opinion, TV and Jobs
-
 bear markets2 weeks ago
A Bear of Historic Proportions – Blockchain News, Opinion, TV and Jobs
-
 Bitcoin2 weeks ago
Virginia passes new crypto law whilst macro headwinds mount up – Blockchain News, Opinion, TV and Jobs
-
 Blockchain2 weeks ago
‘Crypto is just like the end of the 90s with the internet bubble,’ says Hodl CEO Maurice Mureau
-
 Blockchain2 weeks ago
Interview with Ruud Feltkamp, Owner of AI-driven Trading Bot Cryptohopper – Blockchain News, Opinion, TV and Jobs
-
 Blockchain Analytics2 weeks ago
High-profile BAYC collector denies allegations of wrongdoing brought by DeFi detective