
Altcoins
Layer-1 Blockchain Network Passes Decentraland To Become Crypto’s Top Gaming Project for Development: Santiment

A layer-1 blockchain passed the Ethereum (ETH)-based virtual reality platform Decentraland (MANA) to become the top crypto gaming project in terms of development activity, according to the analytics platform Santiment.
Santiment notes that MultiversX (EGLD), formerly known as Elrond, registered 236.93 notable GitHub events, compared to 150.4 events for Decentraland.
The non-fungible token (NFT) layer-2 scaling solution Immutable X (IMX) ranked third with 77.4 GitHub events, and the Ethereum sidechain Skale Network (SKL) clocked in at fourth with 42.6.

Santiment notes that it doesn’t count routine updates and uses a “better methodology” to collect data for GitHub events based on a “backtested process.”
The analytics firm has previously said that heavy development activity centered around a crypto project is a positive indication that could mean that the developers believe the protocol will be successful. It also indicates that the project is less likely to be an exit scam.
MultiversX is a distributed, proof-of-stake blockchain network that is decentralized via more than 3,000 nodes. The project aims to help developers build next-gen applications.
The project’s native token, EGLD, is trading at $35.98. The 103rd-ranked crypto asset by market cap is down more than 7.5% in the past 24 hours and more than 10% in the past month.
Don’t Miss a Beat – Subscribe to get email alerts delivered directly to your inbox
Check Price Action
Follow us on X, Facebook and Telegram
Surf The Daily Hodl Mix
 

Disclaimer: Opinions expressed at The Daily Hodl are not investment advice. Investors should do their due diligence before making any high-risk investments in Bitcoin, cryptocurrency or digital assets. Please be advised that your transfers and trades are at your own risk, and any losses you may incur are your responsibility. The Daily Hodl does not recommend the buying or selling of any cryptocurrencies or digital assets, nor is The Daily Hodl an investment advisor. Please note that The Daily Hodl participates in affiliate marketing.
Generated Image: Midjourney
Source link


Altcoins
‘Welcome to the Bottom of Altcoins’ – Analyst Says Bitcoin Dominance Ready for Largest Plummet in Four Years
A closely followed crypto analyst thinks it’s almost time for altcoins to witness the steepest leg of the bull market.
Pseudonymous analyst TechDev tells his 460,100 followers on the social media platform X that the Bitcoin dominance (BTC.D) chart is flashing a massive bearish reversal signal.
The BTC.D index tracks how much of the total crypto market cap belongs to Bitcoin. A bearish BTC.D chart suggests that altcoins are about to outperform Bitcoin.
According to TechDev, BTC.D is showing a bearish divergence on the five-day chart, indicating that Bitcoin is losing momentum against altcoins.
“The building five-day bearish divergence on Bitcoin dominance says it’s ready for its largest plummet in four years.
Those new to this, welcome to the bottom of altcoins’ wave two. They come at BTC all-time high consolidations.
And you hear about ‘What if no altseason?’
Wait until you see wave three.”
TechDev practices Elliott Wave theory, which states that a bullish asset tends to witness a five-wave surge, where waves one, three and five are upside moves and waves two and four are corrective periods. The theory also states that wave three is the longest wave of the rally.
To support his bullish stance on altcoins, the analyst shares an eight-week chart of the OTHERS index, which tracks the market capitalization of all crypto excluding the ten largest digital assets and stablecoins.
According to TechDev’s chart, OTHERS appears to be retesting its exponential moving average (EMA) as support, similar to what happened in the early stages of the 2017 and 2020 bull markets.
“Altcoins.
Think it’s over? So did they.”
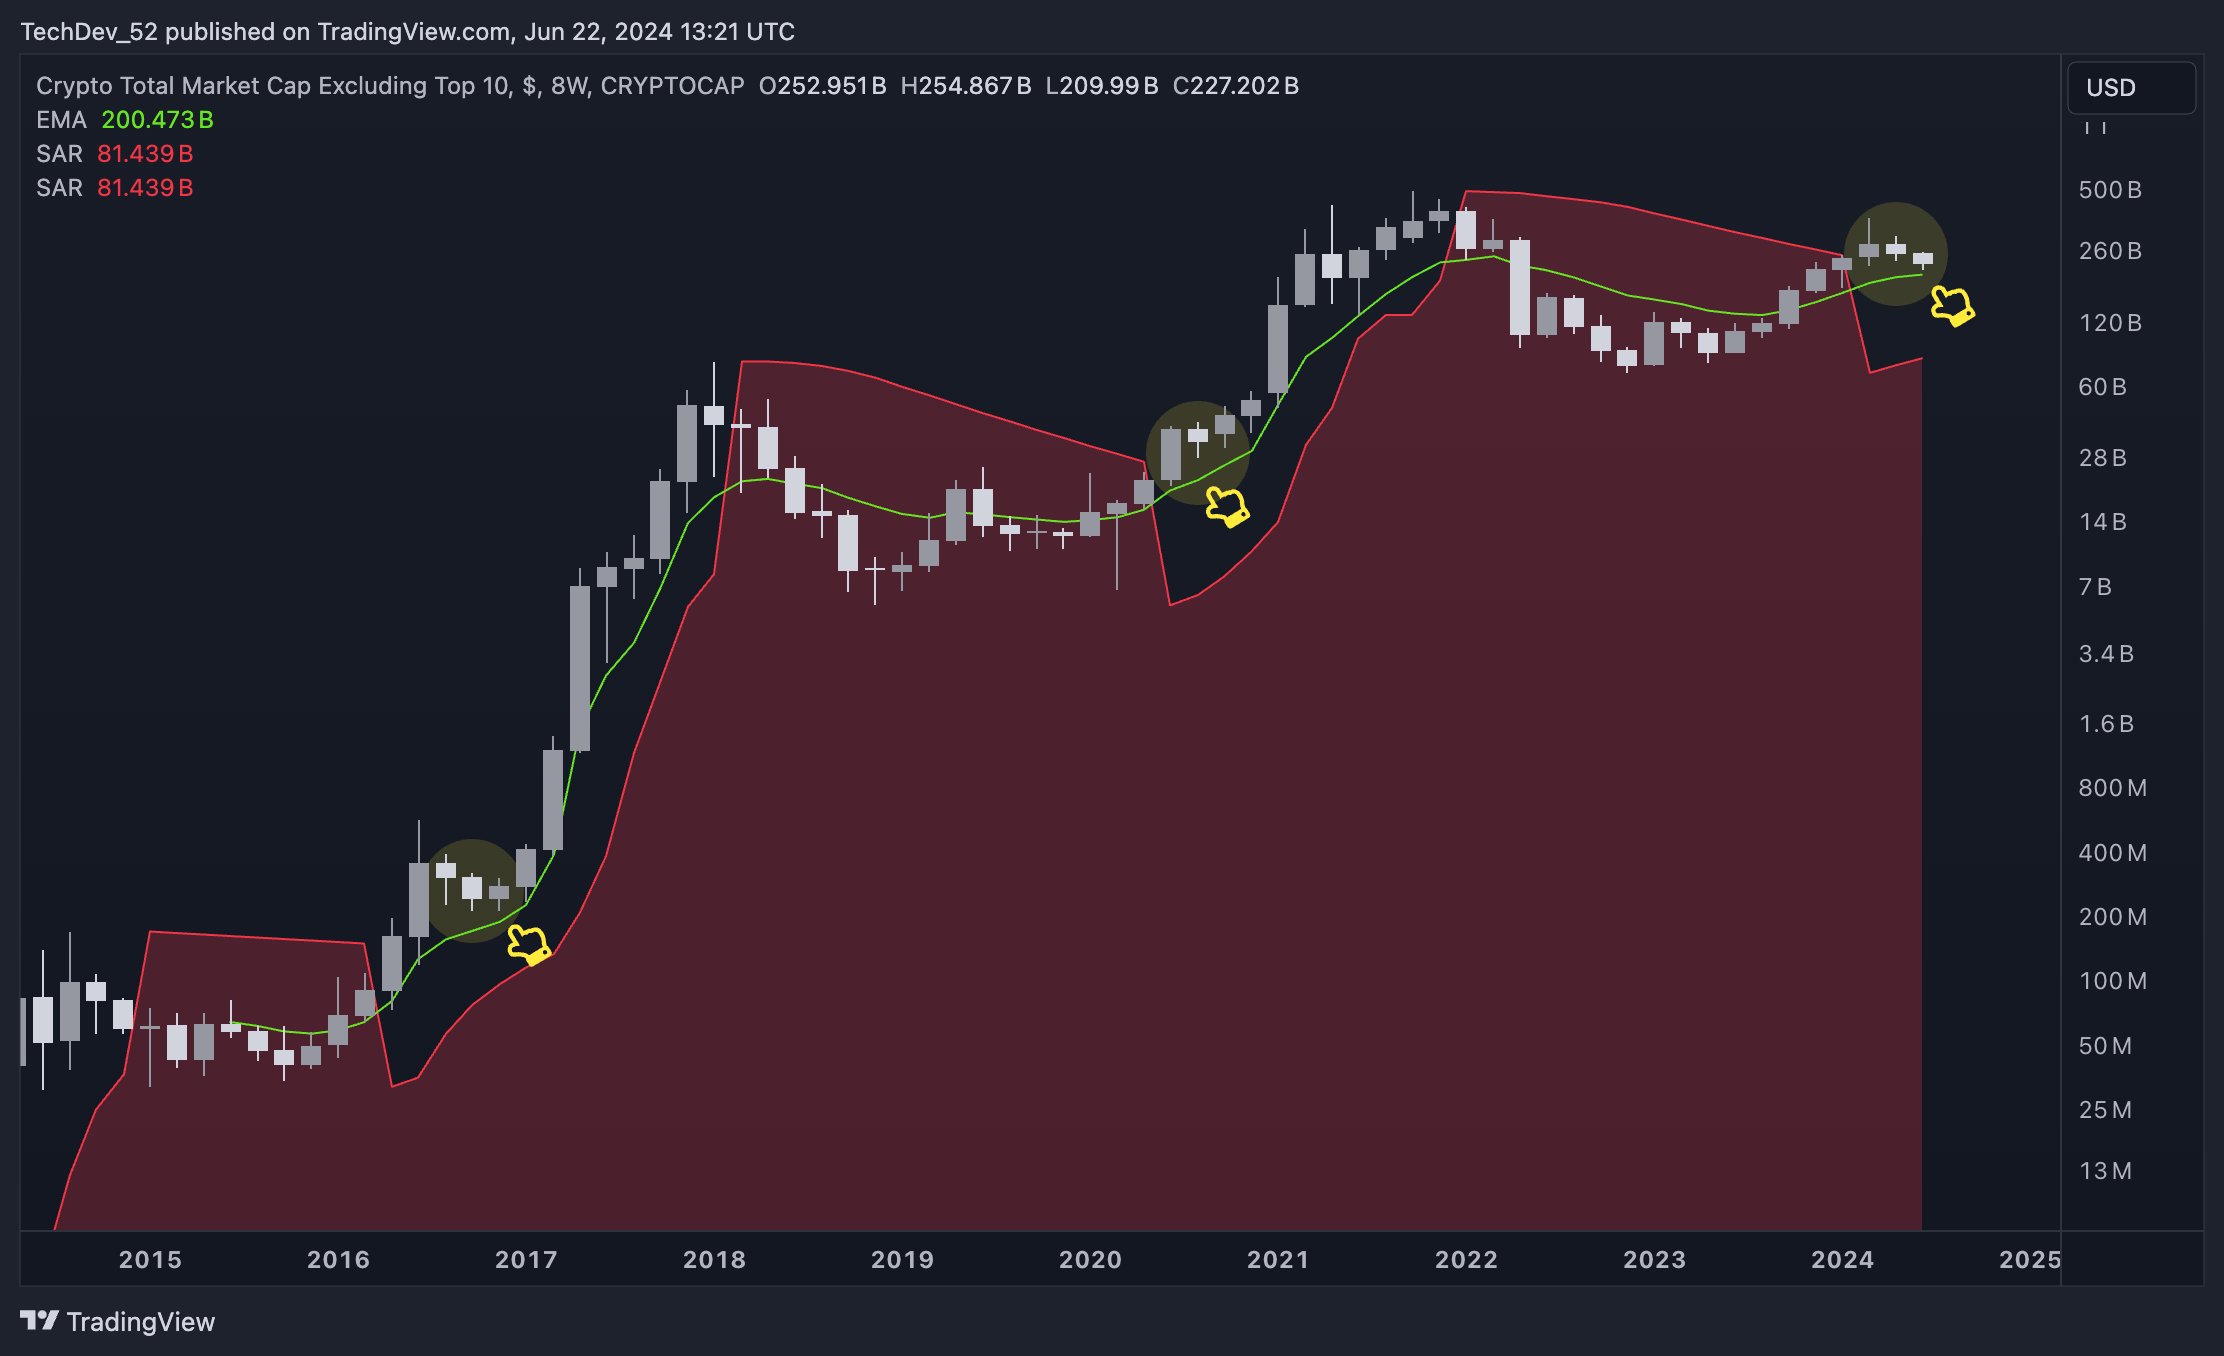
Looking at the trader’s chart, it seems that the EMA is hovering at $200 billion. At time of writing, OTHERS is trading at $222.757 billion.
Don’t Miss a Beat – Subscribe to get email alerts delivered directly to your inbox
Check Price Action
Follow us on X, Facebook and Telegram
Surf The Daily Hodl Mix
 
Disclaimer: Opinions expressed at The Daily Hodl are not investment advice. Investors should do their due diligence before making any high-risk investments in Bitcoin, cryptocurrency or digital assets. Please be advised that your transfers and trades are at your own risk, and any losses you may incur are your responsibility. The Daily Hodl does not recommend the buying or selling of any cryptocurrencies or digital assets, nor is The Daily Hodl an investment advisor. Please note that The Daily Hodl participates in affiliate marketing.
Generated Image: Midjourney
Source link
The price of XRP, the native token of RippleNet, has been caught in the crosshairs of a bearish crypto market. Currently trading below the crucial $0.50 mark, XRP seems to be following the broader market trend. However, a recent analysis by market analyst Tylie Eric throws a glimmer of hope for XRP holders, predicting a potential price surge based on a technical indicator.
Related Reading
Understanding Elliott Wave Theory
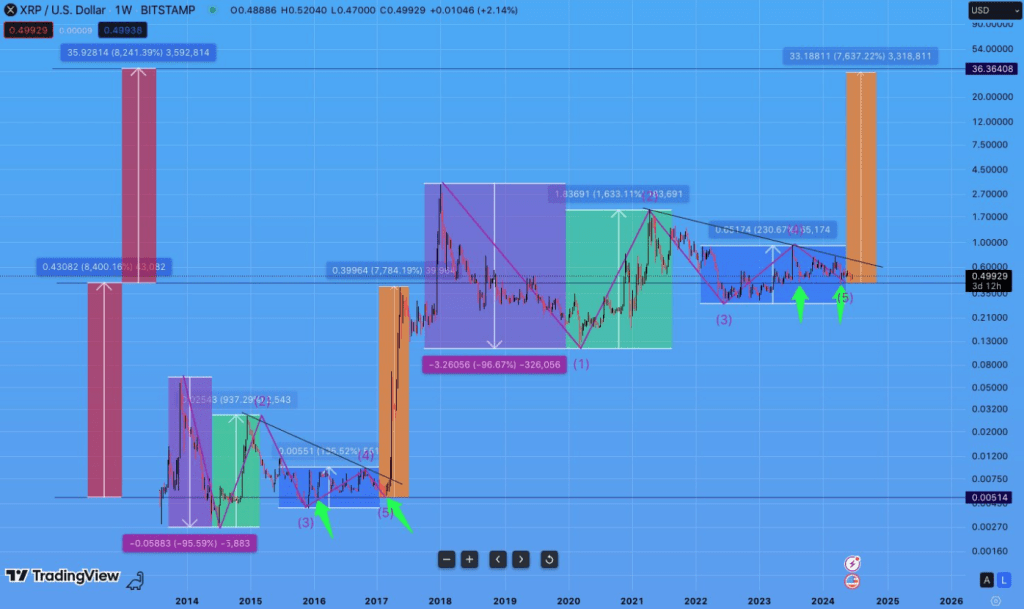
Eric argues that XRP’s price movements might be following a historical pattern known as the Elliott Wave theory. This theory proposes that market trends unfold in a specific five-wave structure, with each wave representing a distinct phase in the price cycle.
According to Eric, XRP has exhibited this five-wave structure on multiple occasions in the past on its weekly chart. Notably, each time this pattern materialized, the fifth and final wave culminated in a significant price increase.
#XRP.
BEAT BY BEAT
I think XRP has ticked all the boxes and held all requirements to continue with wave 3 of wave 5,
Same way it did in 2017! pic.twitter.com/qqexAC7b1X— Tylie E (@TylieEric) June 20, 2024
Eric cites the example of early 2017, where the completion of the fifth wave triggered a surge that propelled XRP to a high of $0.39, a staggering 7,700% increase. This upswing was followed by a brief consolidation period before another decisive rally to $3.30.
A Potential Fifth Wave?
Building on this historical precedent, Eric believes XRP is nearing the conclusion of another five-wave structure that began its formation after the 2017 price drop. His analysis suggests that all four preceding waves have unfolded over the past six years, paving the way for a potential fifth wave that could mirror the dramatic rise witnessed in 2017.
Eric’s audacious prediction hinges on the assumption that the fifth wave will again translate to a substantial price increase. His chart projects a potential upsurge of a staggering 7,630%, which would propel XRP to a price target of a phenomenal $36. This prediction aligns with forecasts from other analysts like CryptoInsightUK, who projected an XRP price surge to $34 last September.
Related Reading
Long Way Ahead
Eric’s prediction hinges on the completion of the Elliott Wave structure, a technical theory that remains a subject of debate among financial experts. Furthermore, the $36 price target appears highly ambitious. It’s important to remember that achieving such a price point would require XRP to surpass the current market capitalization of all cryptocurrencies combined.
Featured image from Getty Images, chart from TradingView
Source link
Altcoins
Ethereum On-Chain Metric Suggests Potential for Altcoin Market Rallies, According to Analytics Firm CryptoQuant

An Ethereum (ETH) on-chain metric suggests the altcoin market could be primed for a price surge, according to the digital asset analytics firm CryptoQuant.
The firm says on the social media platform X that Ethereum’s Market Value to Realized Value (MVRV) indicator is rising faster than Bitcoin’s (BTC) MVRV.
“This suggests that ETH’s market is heating up. Historically, when Ethereum surges, other alts tend to follow.”

MVRV is the ratio of a digital asset’s market capitalization relative to its realized capitalization (the value of all the assets at the price they were bought). It is used to assess whether the token is undervalued or overvalued.
ETH is trading at $3,514 at time of writing. The second-ranked crypto asset by market cap has largely traded sideways this week.
CryptoQuant also notes that Bitcoin is trading below the critical support level of $65,800, which the firm says suggests a potential 8%-12% correction toward $60,000.
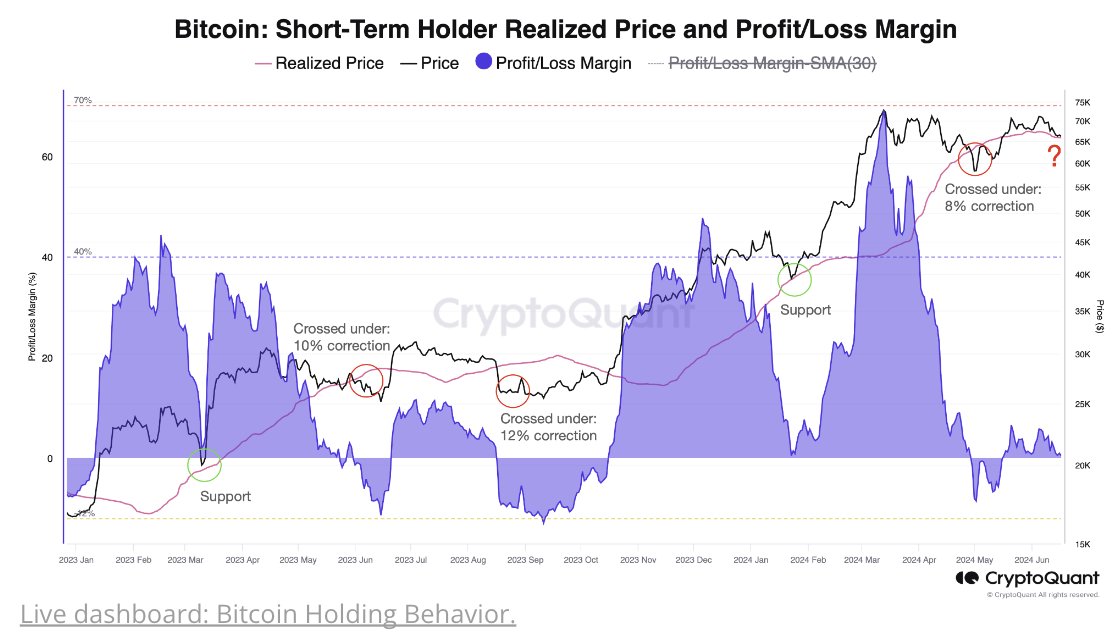
BTC is priced at $64,148 at time of writing. The top-ranked crypto asset by market cap is down nearly 1.5% in the past 24 hours and more than 3% in the past week.
Julio Moreno, CryptoQuant’s head of research, says on X that the Bitcoin market is currently at its least bullish point since September 2023, based on its bull market cycle indicator.

Don’t Miss a Beat – Subscribe to get email alerts delivered directly to your inbox
Check Price Action
Follow us on X, Facebook and Telegram
Surf The Daily Hodl Mix
 
Disclaimer: Opinions expressed at The Daily Hodl are not investment advice. Investors should do their due diligence before making any high-risk investments in Bitcoin, cryptocurrency or digital assets. Please be advised that your transfers and trades are at your own risk, and any losses you may incur are your responsibility. The Daily Hodl does not recommend the buying or selling of any cryptocurrencies or digital assets, nor is The Daily Hodl an investment advisor. Please note that The Daily Hodl participates in affiliate marketing.
Generated Image: Midjourney
Source link

Anonymous Donor Pays $500,000 in Bitcoin for Julian Assange's Freedom Flight

BTC Hashrate decline spurs interest in altcoins: APORK, RNDR, APT emerge

Cardano Price Expected To Hit $40 Next Per Crypto Analysts

Web3 Game Con: The World’s Largest Web3 Game Show Debuts at ABS2024 in Taipei

German Government Moves Millions in Bitcoin to Exchanges

Notcoin surges 10% amid token burn and $4.2m incentive plan

Robert Kiyosaki Decodes Bitcoin’s “Banana Zone”, Contrasts with Fiat Currency

Ron Wyden on FISA Reform and Crypto

Latin America's Largest Fintech Bank Integrates Bitcoin Lightning Payments Via Lightspark

bitter pills in crypto mass adoption?

Solana and Cardano Lead Top 10 Crypto Rebound

This Historical Ethereum Top Signal Is Yet To Appear This Cycle

Bitcoin's Trump Card: Dividing Is The Wrong Move

Florida lawmaker pitches ‘Bitcoin for Taxes’ bill

SEC Chair Says Approval Is Going Smoothly

Bitcoin Dropped Below 2017 All-Time-High but Could Sellers be Getting Exhausted? – Blockchain News, Opinion, TV and Jobs

What does the Coinbase Premium Gap Tell us about Investor Activity? – Blockchain News, Opinion, TV and Jobs
BNM DAO Token Airdrop

NFT Sector Keeps Developing – Number of Unique Ethereum NFT Traders Surged 276% in 2022 – Blockchain News, Opinion, TV and Jobs
New Minting Services
A String of 200 ‘Sleeping Bitcoins’ From 2010 Worth $4.27 Million Moved on Friday

Block News Media Live Stream

SEC’s Chairman Gensler Takes Aggressive Stance on Tokens – Blockchain News, Opinion, TV and Jobs

Friends or Enemies? – Blockchain News, Opinion, TV and Jobs

Enjoy frictionless crypto purchases with Apple Pay and Google Pay | by Jim | @blockchain | Jun, 2022

Block News Media Live Stream

How Web3 can prevent Hollywood strikes

Block News Media Live Stream

XRP Explodes With 1,300% Surge In Trading Volume As crypto Exchanges Jump On Board
Block News Media Live Stream
 Altcoins2 years ago
Bitcoin Dropped Below 2017 All-Time-High but Could Sellers be Getting Exhausted? – Blockchain News, Opinion, TV and Jobs
 Binance2 years ago
What does the Coinbase Premium Gap Tell us about Investor Activity? – Blockchain News, Opinion, TV and Jobs
- Uncategorized2 years ago
BNM DAO Token Airdrop
 BTC1 year ago
NFT Sector Keeps Developing – Number of Unique Ethereum NFT Traders Surged 276% in 2022 – Blockchain News, Opinion, TV and Jobs
- Uncategorized3 years ago
New Minting Services

 Bitcoin miners2 years ago
A String of 200 ‘Sleeping Bitcoins’ From 2010 Worth $4.27 Million Moved on Friday
 Video2 years ago
Block News Media Live Stream
 Bitcoin1 year ago
SEC’s Chairman Gensler Takes Aggressive Stance on Tokens – Blockchain News, Opinion, TV and Jobs
