
ETH
What to Expect for Ethereum Price in July Based on Historical Trends

June Month was notably bearish for the cryptocurrency market with many assets revisiting their monthly support. Amid the market sell-off, the Ethereum price plunged from a high of $3887 to a low of $3232 registering a loss of 16.9%. However, the downfall lies within the healthy retracement of Fibonacci tools indicating a strong could allow ETH bulls to counterattack.
Also Read: Crypto Market This Week: Ethereum ETF, FOMC Minutes, US Job Data & Trade Deficit
Ethereum Price Eyes Stability as 78% of ETH is Held by Long-Term Holders

The near-term trend in Ethereum price is sideways evidenced by a new lower high formation at $3975 in late May. This reversal indicates the overhead supply is high from market sellers and ETH buyers would need time to recuperate its momentum.
Connecting the overhead peaks with a trendline reveals a potential triangle formation as the altcoin has also received dynamic support from an ascending trendline since October 2023.
The Ethereum price currently trades at $3389 and holds a market cap of $407.3 Billion. If the supply pressure persists, the coin price could plunge another 5% to seek support at the long-coming trendline.
The renewed buying pressure from the trendline could uplift the asset by 14-15% and challenge the triangle’s upper boundary at $3860. A bullish breakout from the triangle pattern will signal a better confirmation of uptrend continuation.
Also Read: ETH/BTC Pair Poised for Breakout as Ethereum ETF Launch Approaches: What’s Next?
In a recent tweet, the prominent crypto analytics firm IntoTheBlock revealed a striking statistic: 78% of Ether is currently held by long-term holders. Despite the volatility in Ethereum’s price, the proportion of ETH held by long-term investors has steadily increased, indicating a strong belief in the asset’s future value.
78% of ETH is owned by long-term hodlers pic.twitter.com/9vb5kaUIar
— IntoTheBlock (@intotheblock) June 28, 2024
Ethereum’s price performance in July has exhibited a mix of gains and declines over the past several years, reflecting the broader market’s volatility and investor sentiment. The biggest gain was +56.62% in 2022, while the largest drop was -27.29% in 2017.
On average, July has a positive return of +6.95%, though the median return is -4.41%, indicating mixed performance.

However, with the ongoing development around U.S-listed Ethereum ETFs, anticipated to launch around mid-July, the odds strongly lean on buyers’ favor.
Technical Indicator
- BB Indicator: An upswing in the lower boundary of the Bollinger Band indicator losing bearish momentum and additional support for buyers to rebound.
- Moving Average Convergence Divergence: A negative crossover between the MACD and signal line highlights the near-term trend is intact and bearish.
Frequently Asked Questions (FAQs)
A3: Long-term holders, who currently own 78% of Ethereum, play a crucial role in its market stability. Their sustained investment indicates a strong belief in Ether’s long-term value.
The anticipated launch of U.S-listed Ethereum ETFs could significantly influence ETH price by potentially increasing buyer interest and investment. This development is expected to provide easier access for a broader range of investors.
The Fear and Greed Index measures investor sentiment in the market, which can be a useful indicator for traders to gauge the general mood among market participants.
Related Articles
The presented content may include the personal opinion of the author and is subject to market condition. Do your market research before investing in cryptocurrencies. The author or the publication does not hold any responsibility for your personal financial loss.
Source link


The weekends are mostly neutral for the cryptocurrency market as the digital assets are trying to stabilize after a recent sell-off. The Bitcoin price seeking support at $55000 has eased the supply pressure for altcoin as ETH price also shows renewed demand at $1815. However, with several analysts anticipating the Ethereum ETF launch around mid-July, there is potential for a major reversal in ETH’s price.
Also Read: Justin Sun Faces $66M Loss As Ethereum Records 10% Fall, Here’s Why
Ethereum Price Analysis Hints $3800 Rally Amid Healthy Pullback and Potential ETF Approval

The current correction in Ethereum price was initiated in late May as the price reverted from $3974. This fresh lower-high formation of the daily chart indicates the buyers lack sufficient momentum to chase new highs, thus shifting the price trajectory sideways.
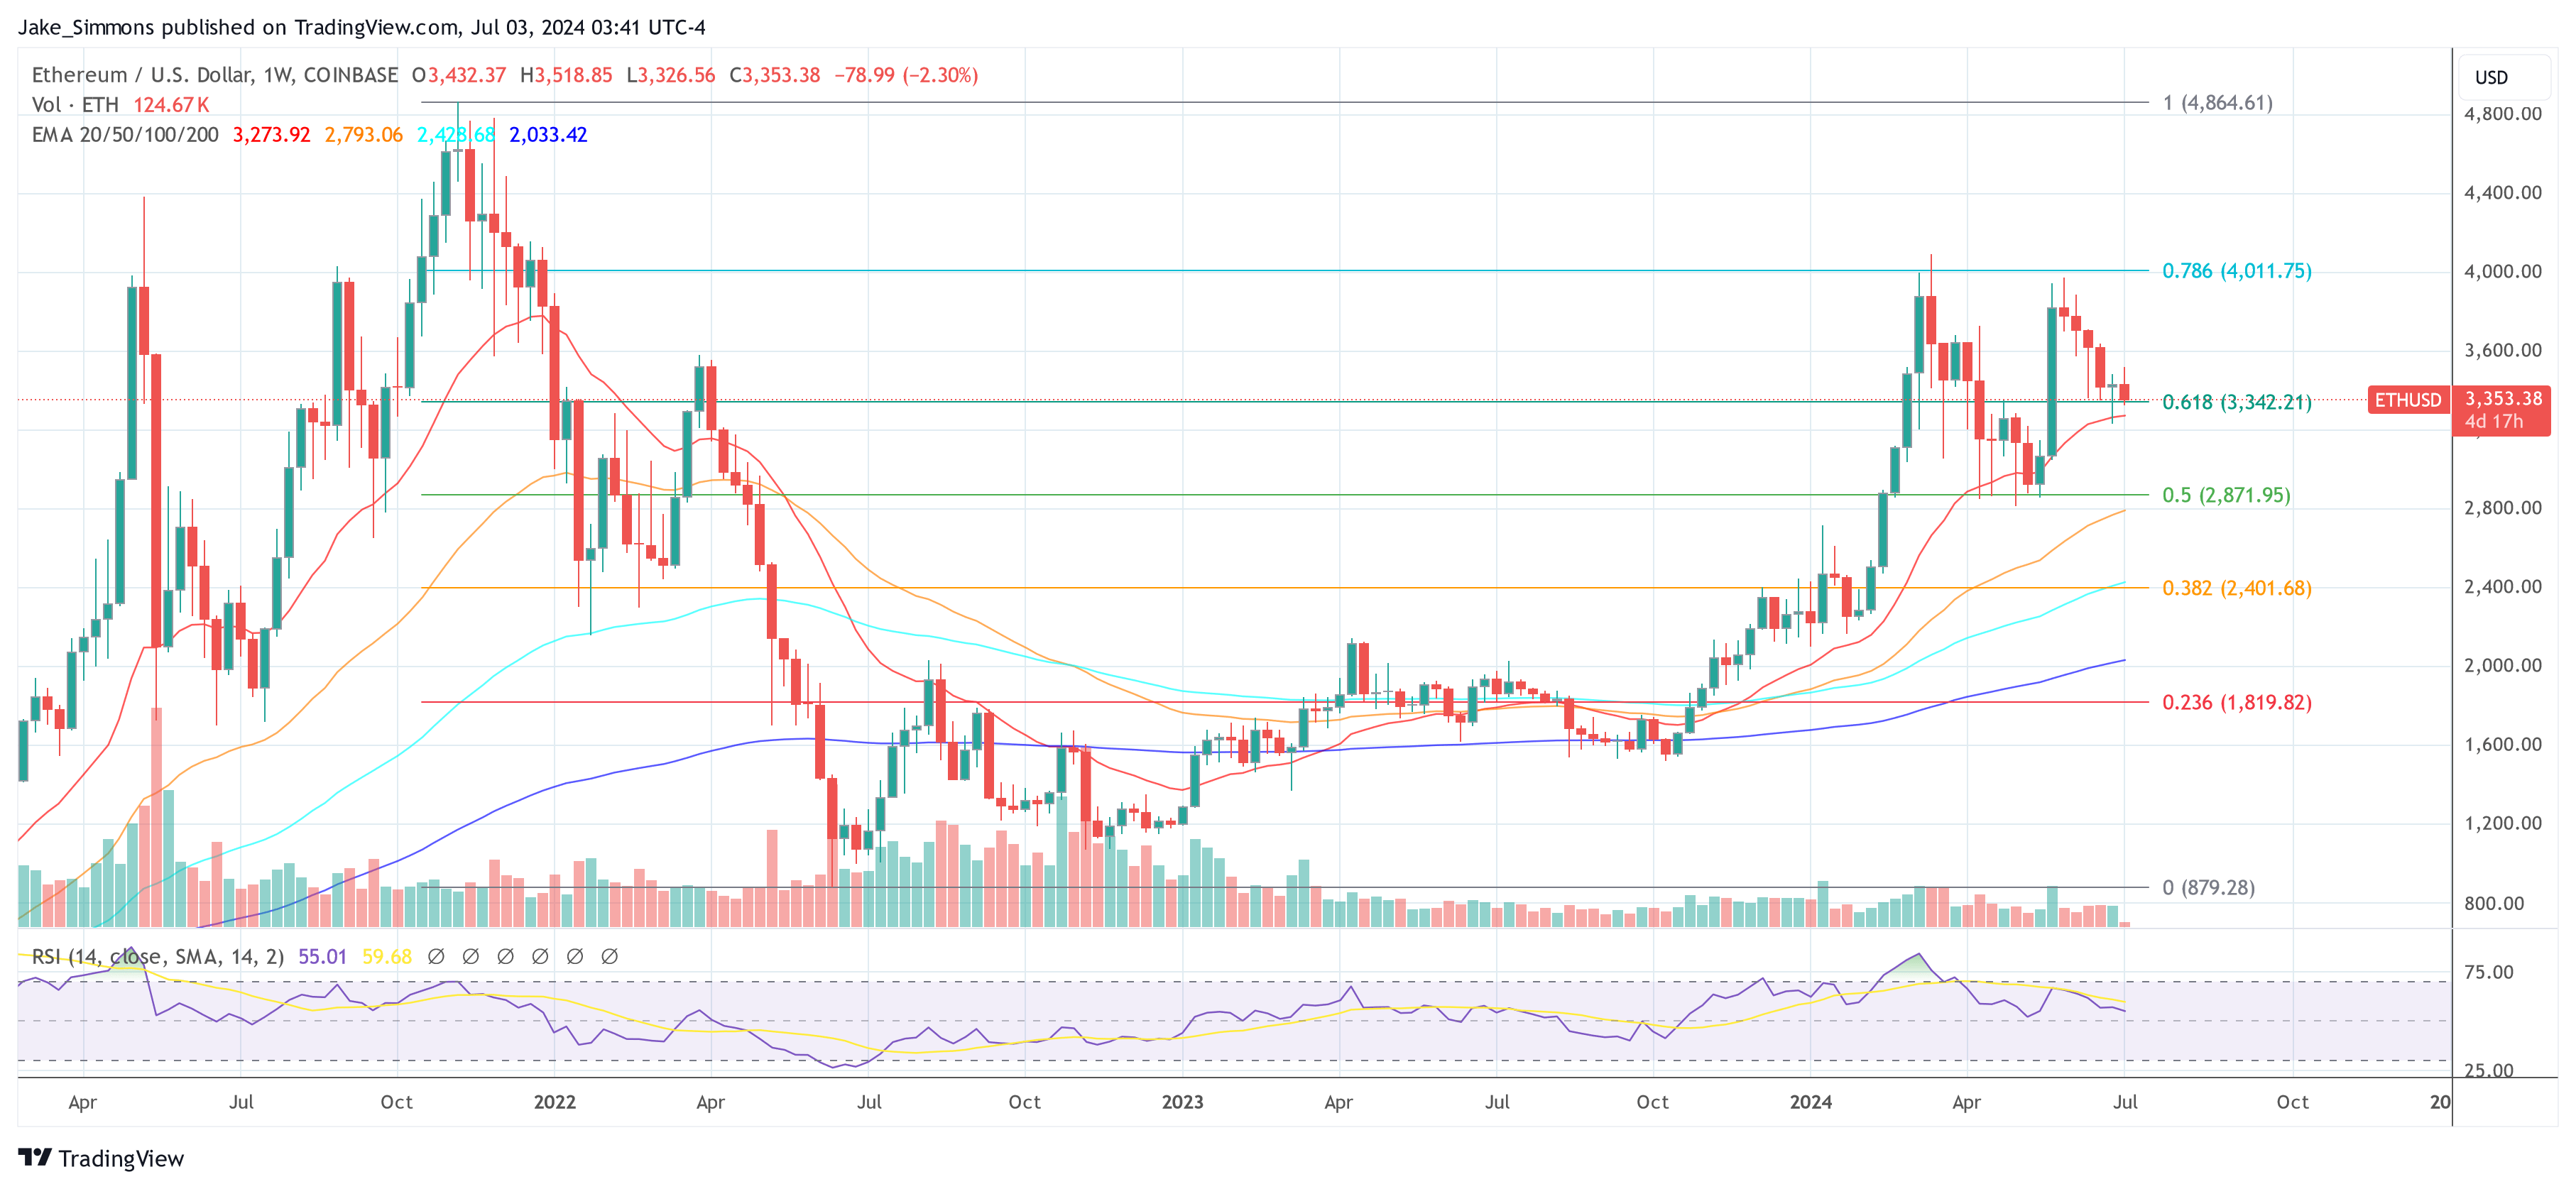
The bearish turnaround tumbled the Ether value by nearly 30% to seek support at the confluence of $1815 and 23.6% Fibonacci retracement level. Along with broader market correction, the U.S. SEC’s delay in approving ETH ETF issuers’ S-1 drafts has contributed to bearish sentiment.
On Thursday, Bitwise filed an amended S-1 for its spot Ethereum ETF ahead of the July 8th deadline. Bloomberg’s ETF analyst Eric Balchunas highlighted that the SEC’s recent comments required minimal updates, indicating a quick turnaround for Bitwise.
However, the filing has no fee details yet, which are expected to be revealed next week. Bitwise’s proactive filing suggests they are expediting the approval process for their Ethereum ETF.
Also Read: Altcoins To Stake Without Hesitation As Bitcoin Goes Burst
Moreover, the President of the ETF Store Nate Geraci, has expressed confidence that spot Ethereum ETFs will start trading within the next two weeks, mostly around the week of July 15th. Geraci also notes that the ETH price has dropped by over 20% since the unexpected 19b-4 approvals in late May.
Will be *shocked* if spot eth ETFs not trading w/in next 2 weeks…
Later next week a possibility, but think week of July 15th more likely.
Interestingly, price of eth ↓ 20%+ since “surprise” 19b-4 approvals in late May.
— Nate Geraci (@NateGeraci) July 6, 2024
If approved, the ETH price could defy a sluggish market trend/mild selling pressure and rebound 36% to challenge the downsloping trendline around $3800. A bullish breakout from the resistance is crucial to signal renewed recovery in the Ethereum coin.
Technical Indicator
- EMAs: The 200D EMA at $3080 and 100D Exponential Moving Average at $3330 highlight the immediate resistance against buyers.
- RSI: The Relative Strength Index (RSI) dived to the oversold region below 30% could attract dip investors in the market.
Frequently Asked Questions (FAQs)
A Spot Ethereum ETF is an exchange-traded fund that directly holds Ethereum (ETH) as its underlying asset
The Relative Strength Index (RSI) is a momentum oscillator that measures the speed and change of price movements
An S-1 filing is a registration statement that companies must file with the SEC before going public.
Related Articles
The presented content may include the personal opinion of the author and is subject to market condition. Do your market research before investing in cryptocurrencies. The author or the publication does not hold any responsibility for your personal financial loss.
Source link
The crypto industry is on the verge of a potentially significant development as key figures in the sector hint at the imminent approval of a spot Ethereum ETF in the United States, possibly triggering a notable price rally for ETH.
Nate Geraci, president of The ETF Store, shared insights into the expected timeline for the launch of the first spot Ethereum ETF.
According to Geraci, current forecasts by Bloomberg predict a mid-July launch. He detailed the procedural timeline via X, stating, “Wen spot eth ETF? BBG sticking w/ mid-July. Amended S-1s due July 8th. Potential final S-1s by July 12th. Would theoretically mean launch week of July 15th.”
In parallel, Steve Kurz, head of asset management at Galaxy Digital, confirmed to Bloomberg on July 2 that the U.S. Securities and Exchange Commission (SEC) might greenlight a spot Ethereum ETF before the month’s end.
Related Reading
Kurz emphasized the extensive groundwork laid in collaboration with the SEC, drawing parallels between the proposed Ethereum ETF and Galaxy’s existing spot Bitcoin ETF (BTCO), created with Invesco. Kurz expressed confidence in their preparedness, remarking, “We know the plumbing, we know the process… The SEC is engaged.”
Bloomberg ETF analyst Eric Balchunas also chimed in, aligning with the mid-July expectations. He highlighted the SEC’s recent instructions to Ethereum ETF issuers for amending their S-1 registration forms by July 8, suggesting possible further amendments. Notably, the SEC approved rule changes under 19-b4 in May, facilitating the listing and trading of such funds, though the issuance of funds remained pending final approvals.
Ethereum Price Holds Above Key Support
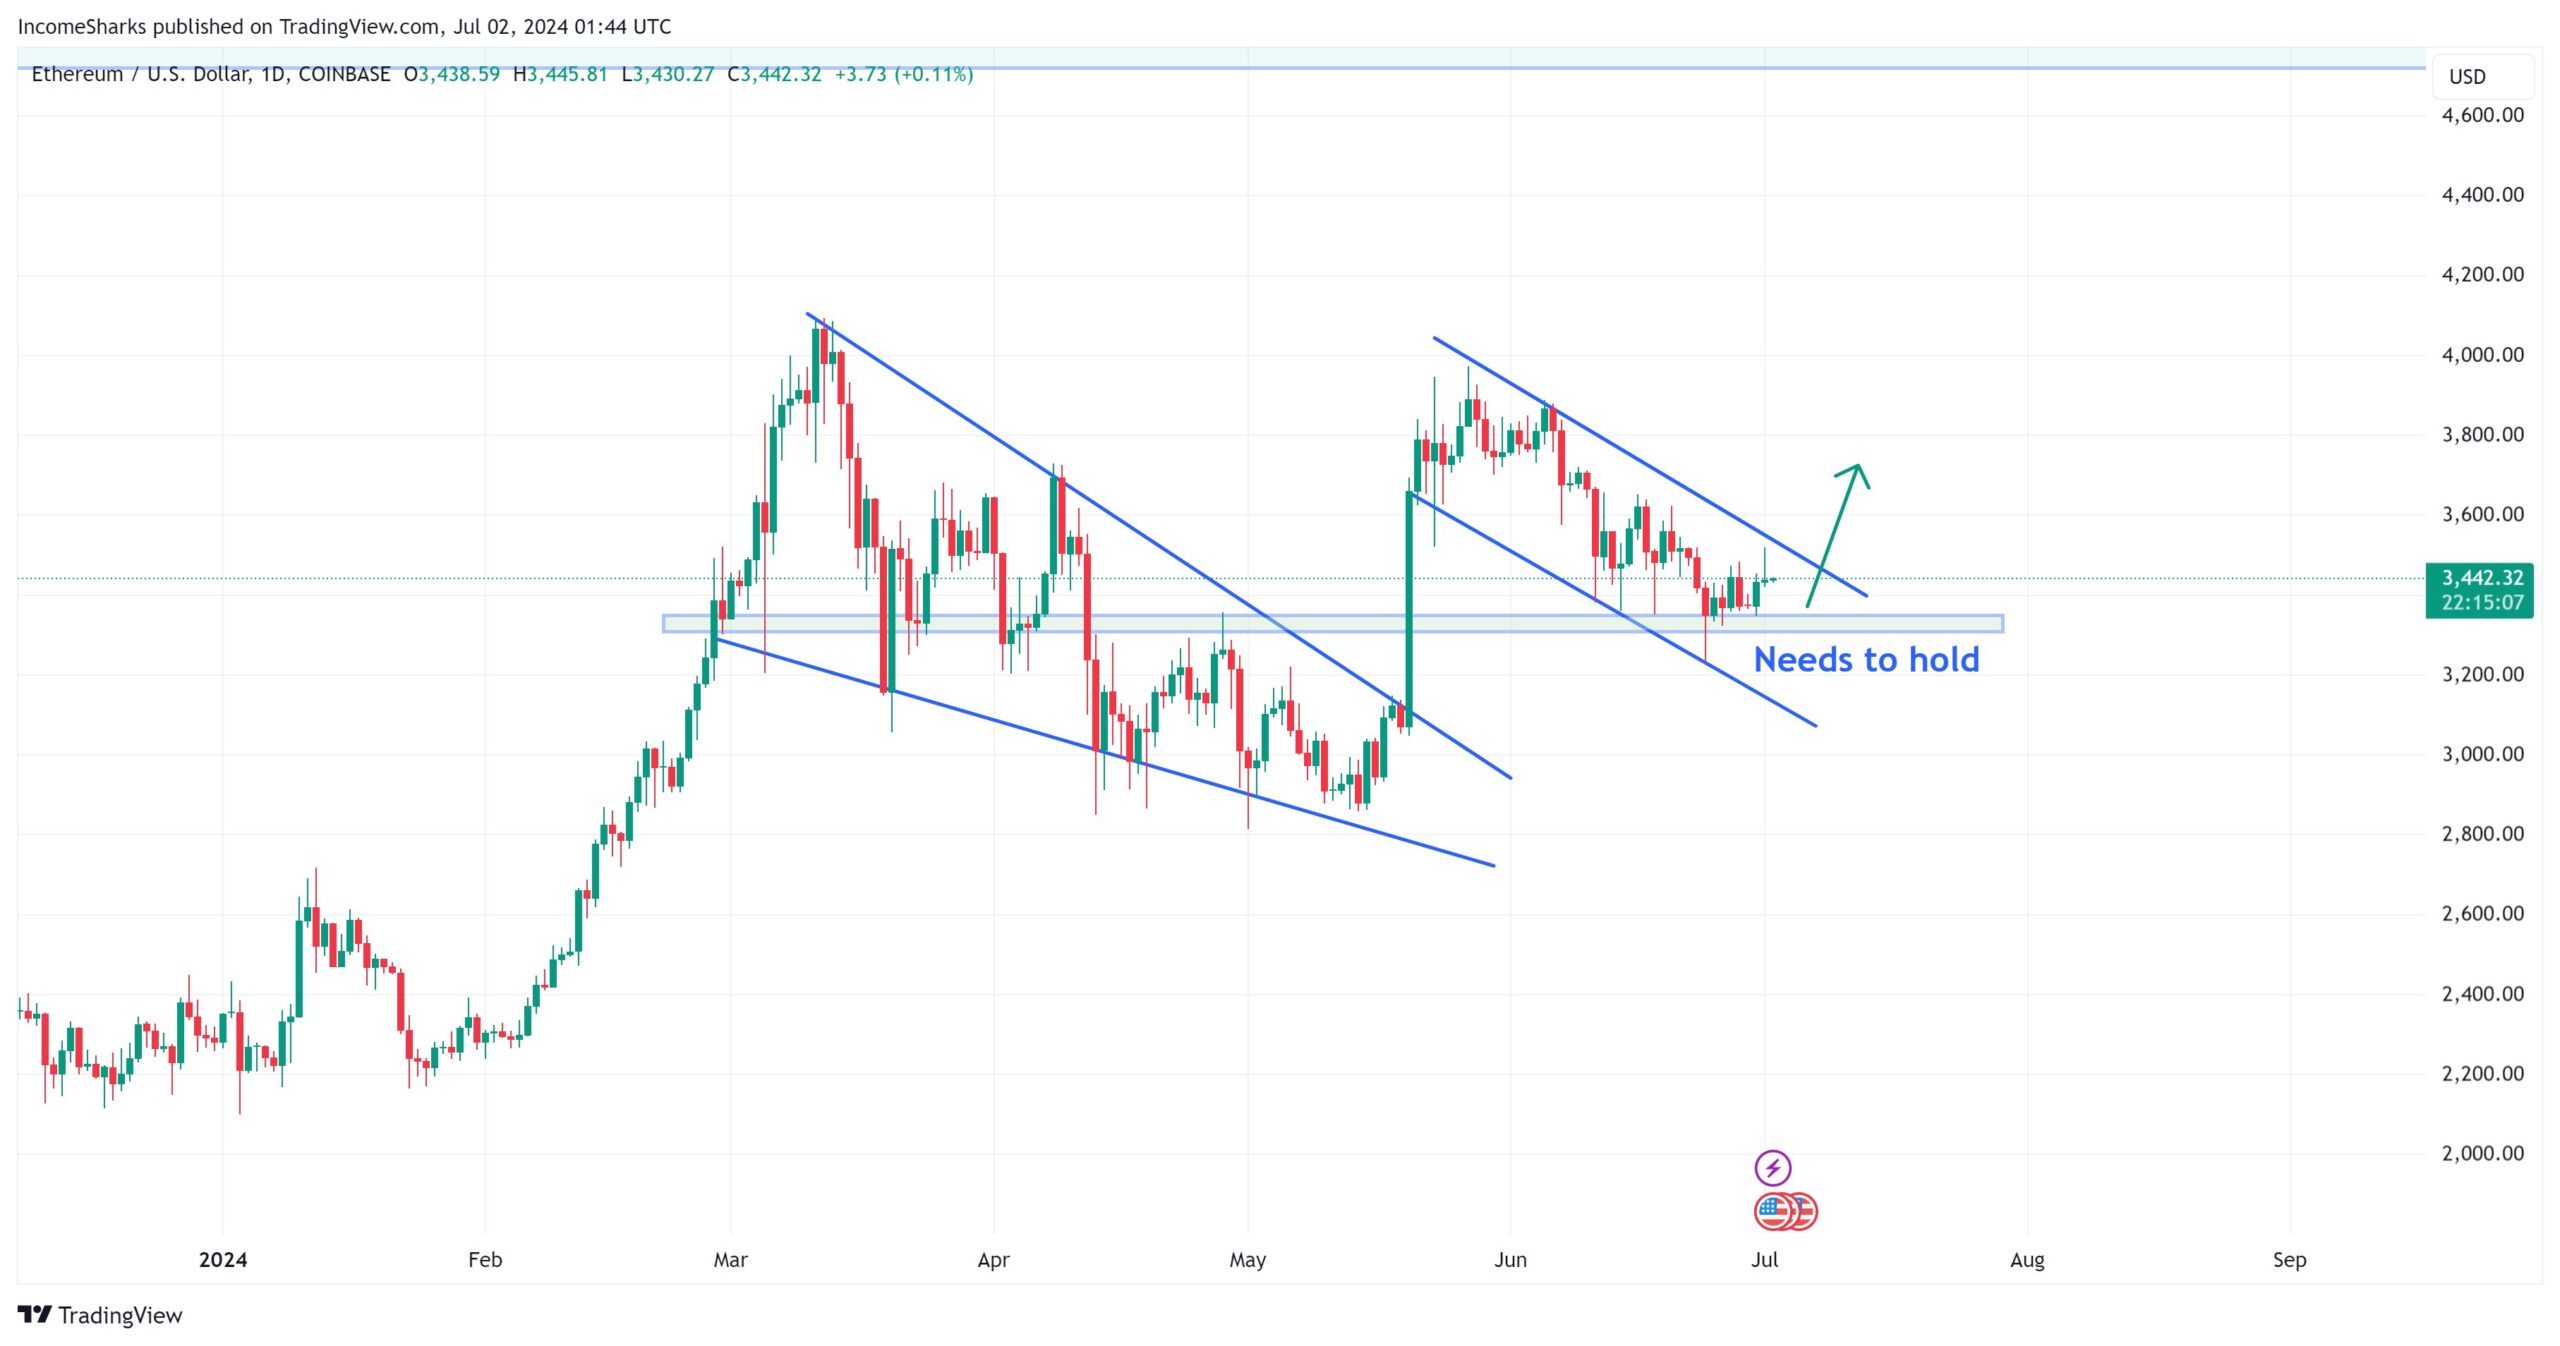
The anticipation of these approvals appears to be having a stabilizing effect on Ethereum prices. Crypto analyst IncomeSharks, commenting on Ethereum’s current price trajectory via X, noted optimism for a near-term breakout, stating, “ETH – Looking more optimistic for a Q3 breakout. Liking the chances of a run towards $4,000 this or next month.” According to the chart shared by him, ETH price needs to hold the region of $3,300 to $3,350 in order to rally to $4,000.

Supporting this sentiment, Cold Blooded Shiller highlighted the crucial need for Ethereum to demonstrate momentum at the current price levels, specifically around the $3,400 mark, as a key indicator for a potential high-time-frame impulse.
Related Reading
“ETH is still in a fine position but it really needs to start showing some momentum soon. LTF divergences around this $3400 low are probably where I take one stab at trying to capture any HTF impulse away from the consolidation,” he remarked via X.
Adding historical perspective, analyst Jelle (@CryptoJelleNL) compared the current market phase to Ethereum’s long consolidation in 2016-2017 before its massive rally, urging persistence and optimism: “In 2016-2017, ETH consolidated for 50+ weeks before rallying nearly 12000 percent. Today, people are giving up after less than 20 weeks, with ETH ETFs right around the corner. Stick to the plan boys. The best is yet to come.”
At press time, ETH traded at $3,353.
Featured image created with DALL·E, chart from TradingView.com
Source link

Digital assets manager CoinShares says that institutional crypto products sustained outflows last week for the third week in a row.
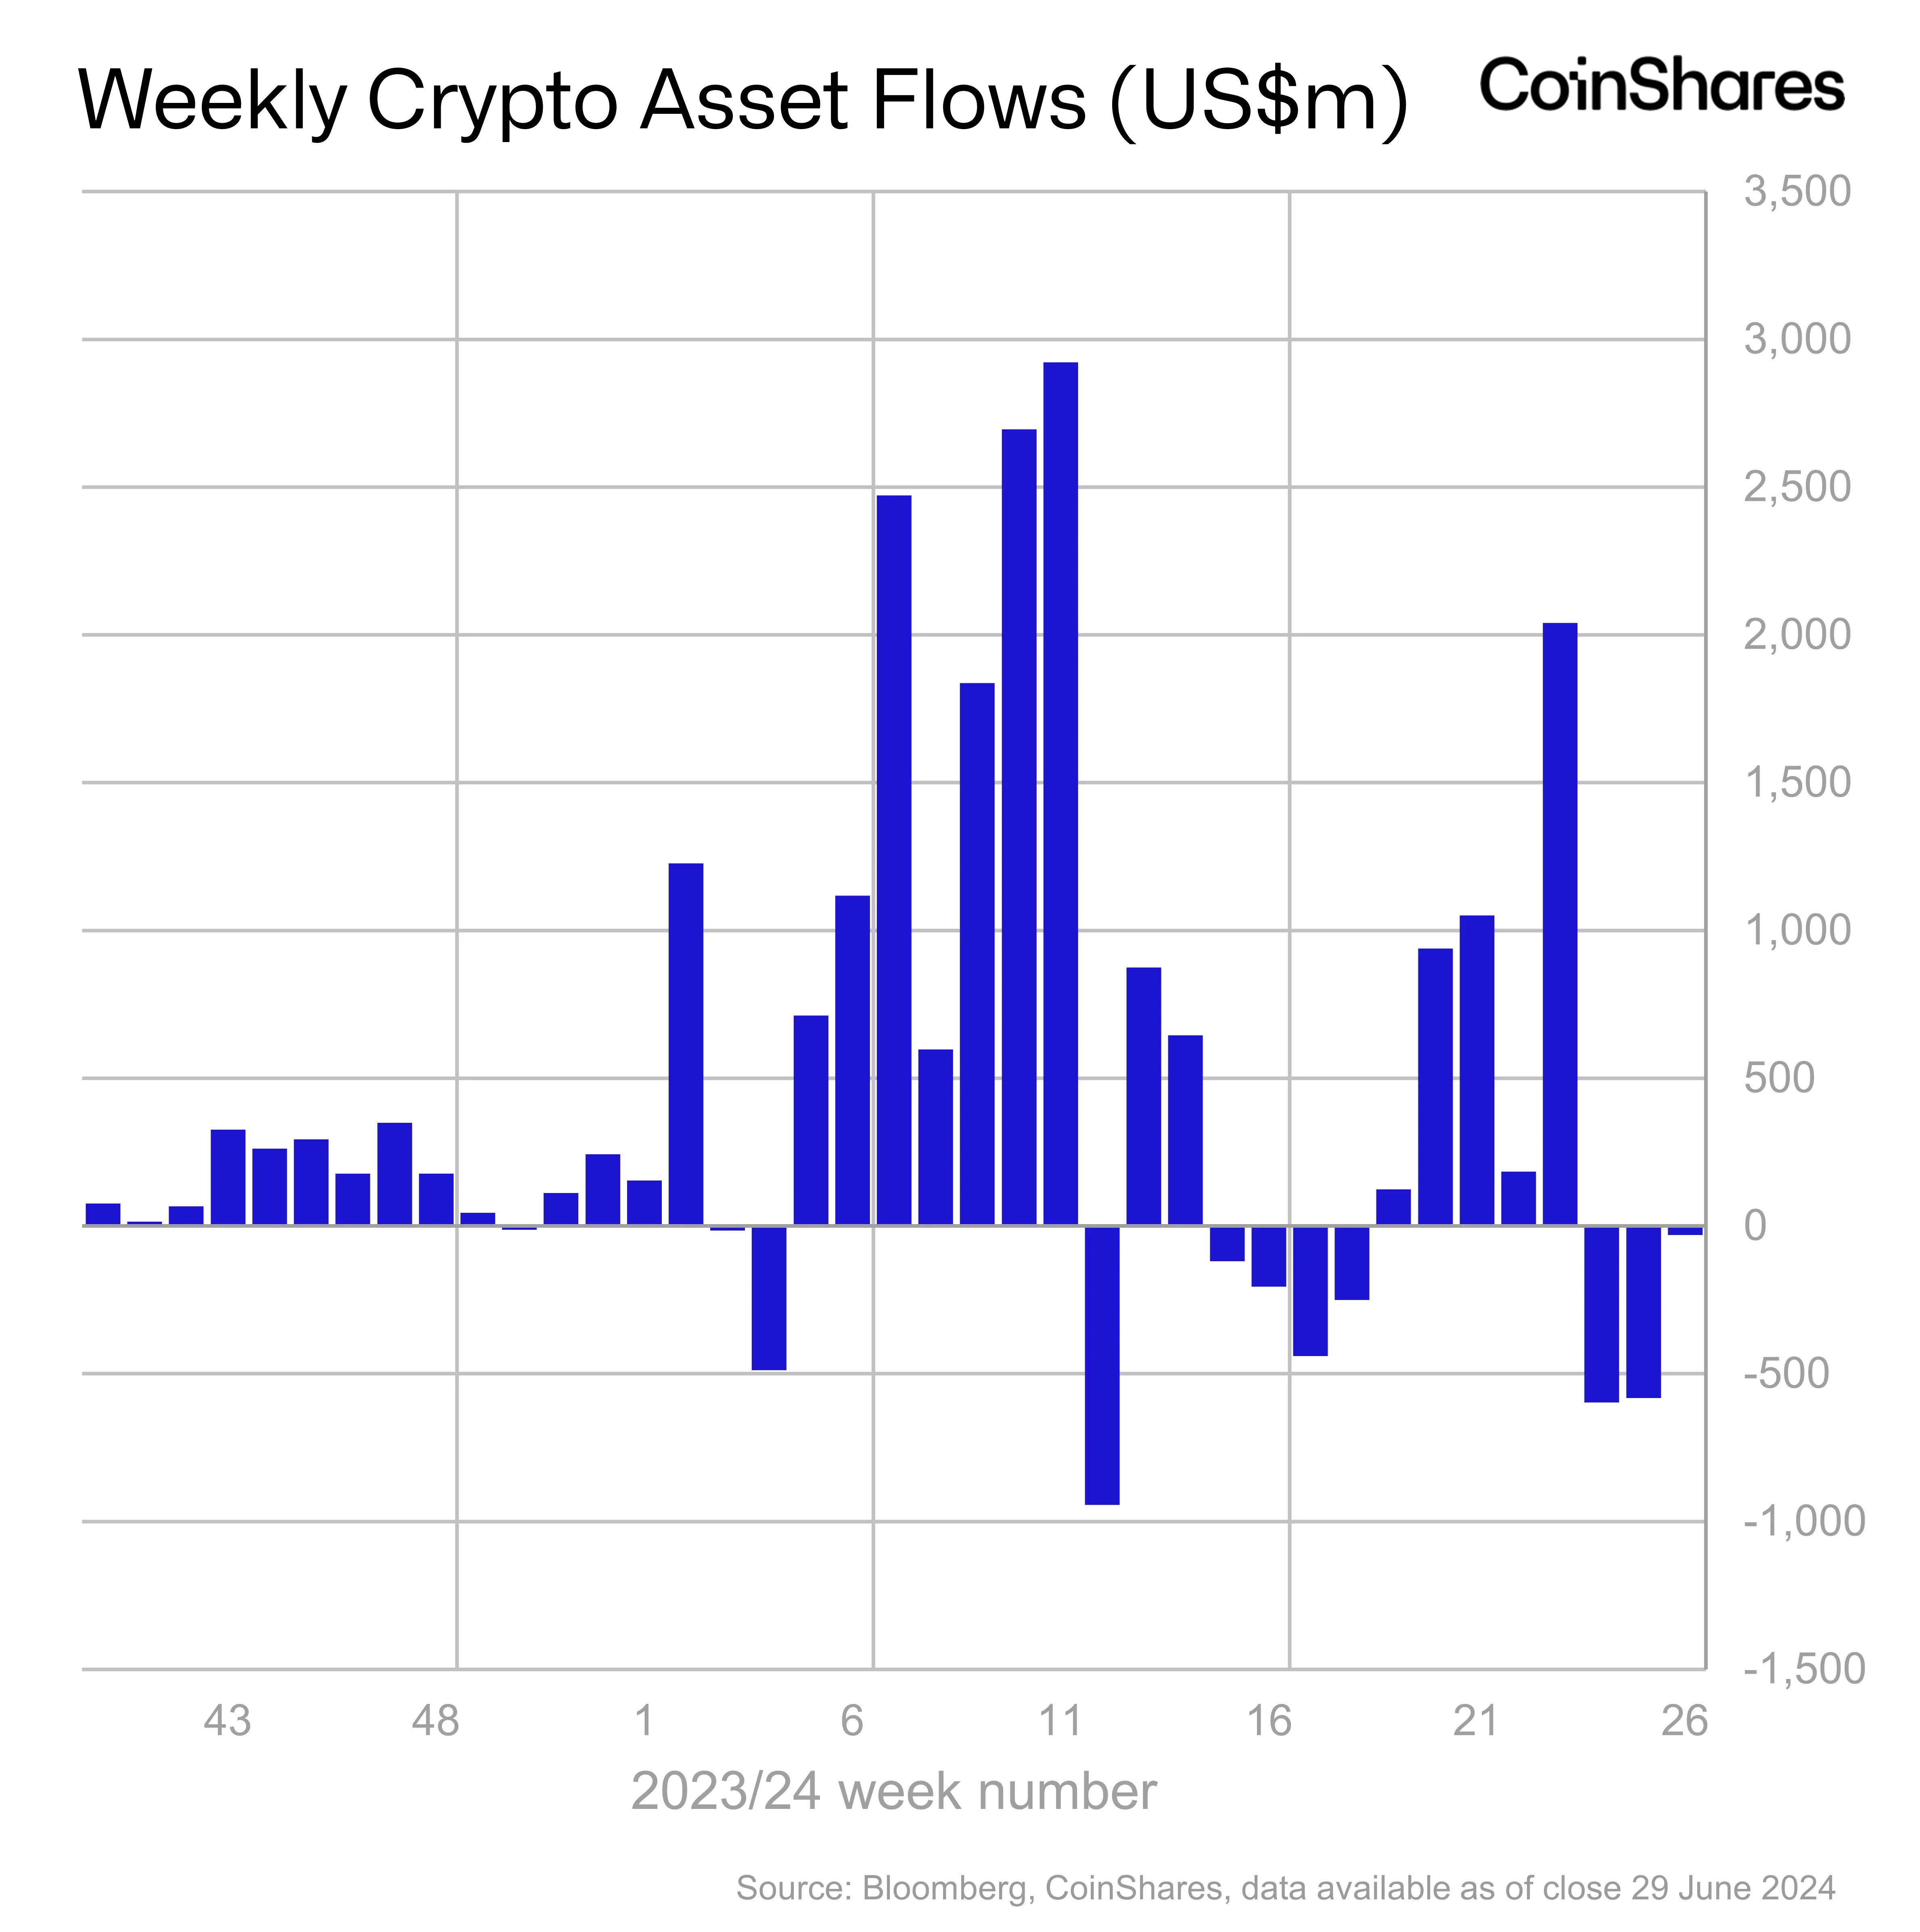
In its latest Digital Asset Fund Flows report, CoinShares says digital asset investment products suffered $30 million in outflows last week.
“Digital asset investment products saw a third consecutive week of outflows totaling US$30m, with last week indicating a significant stemming of the outflows. In contrast to prior weeks, most providers saw minor inflows, although this was offset by incumbent Grayscale seeing US$153m outflows.”
Despite overall outflows, the US, Brazil and Australian regions saw $43 million, $7.6 million and $3 million in inflows, respectively.
“Negative sentiment pervaded Germany, Hong Kong, Canada and Switzerland with outflows of US$29m, US$23m, US$14m and US$13m respectively.”
While the leading crypto by market cap Bitcoin (BTC), multi-asset investment vehicles, Solana (SOL) and Litecoin (LTC) brought in $18 million, $10 million, $1.6 million and $1.4 million in inflows, Ethereum (ETH) had one of its worst weeks in years.
“Ethereum saw the largest outflows since August 2022, totaling US$61m, bringing the last two weeks of outflows to US$119m, making it the worst performing asset year-to-date in terms of net flows.”
Chainlink (LINK) and XRP also brought in $0.6 million and $0.3 million, respectively.
Don’t Miss a Beat – Subscribe to get email alerts delivered directly to your inbox
Check Price Action
Follow us on X, Facebook and Telegram
Surf The Daily Hodl Mix
 

Disclaimer: Opinions expressed at The Daily Hodl are not investment advice. Investors should do their due diligence before making any high-risk investments in Bitcoin, cryptocurrency or digital assets. Please be advised that your transfers and trades are at your own risk, and any losses you may incur are your responsibility. The Daily Hodl does not recommend the buying or selling of any cryptocurrencies or digital assets, nor is The Daily Hodl an investment advisor. Please note that The Daily Hodl participates in affiliate marketing.
Featured Image: Shutterstock/phive/Sensvector
Source link
Bitcoin (BTC) Price, Volume Contrasts In Fight For Rebound

The German Government Is Selling More Bitcoin – $28 Million Moves to Exchanges
BC.GAME Announces the Partnership with Leicester City and New $BC Token!

Justin Sun Says TRON Team Designing New Gas-Free Stablecoin Transfer Solution

Mt. Gox is a ‘thorn in Bitcoin’s side,’ analyst says

XRP Eyes Recovery Amid Massive Accumulation, What’s Next?

Germany Moves Another $28 Million in Bitcoin to Bitstamp, Coinbase

'Asia's MicroStrategy' Metaplanet Buys Another ¥400 Million Worth of Bitcoin

BlackRock’s BUIDL adds over $5m in a week despite market turbulence

Binance To Delist All Spot Pairs Of These Major Crypto

German Government Sill Holds 39,826 BTC, Blockchain Data Show

HIVE Digital stock rallies over 9% as Bitcoin miner bolsters crypto reserves to 2.5k BTC

Pepe Price Analysis Reveals Bullish Strength As Bitcoin Plummets

Taiwan is not in a CBDC rush as central bank lacks timetable

Will SHIB Price Reclaim $0.00003 Mark By July End?

Bitcoin Dropped Below 2017 All-Time-High but Could Sellers be Getting Exhausted? – Blockchain News, Opinion, TV and Jobs

What does the Coinbase Premium Gap Tell us about Investor Activity? – Blockchain News, Opinion, TV and Jobs
BNM DAO Token Airdrop
A String of 200 ‘Sleeping Bitcoins’ From 2010 Worth $4.27 Million Moved on Friday

NFT Sector Keeps Developing – Number of Unique Ethereum NFT Traders Surged 276% in 2022 – Blockchain News, Opinion, TV and Jobs
New Minting Services

Block News Media Live Stream

SEC’s Chairman Gensler Takes Aggressive Stance on Tokens – Blockchain News, Opinion, TV and Jobs

Friends or Enemies? – Blockchain News, Opinion, TV and Jobs

Enjoy frictionless crypto purchases with Apple Pay and Google Pay | by Jim | @blockchain | Jun, 2022

How Web3 can prevent Hollywood strikes

Block News Media Live Stream

Block News Media Live Stream
Block News Media Live Stream

XRP Explodes With 1,300% Surge In Trading Volume As crypto Exchanges Jump On Board
 Altcoins2 years ago
Bitcoin Dropped Below 2017 All-Time-High but Could Sellers be Getting Exhausted? – Blockchain News, Opinion, TV and Jobs
 Binance2 years ago
What does the Coinbase Premium Gap Tell us about Investor Activity? – Blockchain News, Opinion, TV and Jobs
- Uncategorized3 years ago
BNM DAO Token Airdrop

 Bitcoin miners2 years ago
A String of 200 ‘Sleeping Bitcoins’ From 2010 Worth $4.27 Million Moved on Friday
 BTC1 year ago
NFT Sector Keeps Developing – Number of Unique Ethereum NFT Traders Surged 276% in 2022 – Blockchain News, Opinion, TV and Jobs
- Uncategorized3 years ago
New Minting Services
 Video2 years ago
Block News Media Live Stream
 Bitcoin1 year ago
SEC’s Chairman Gensler Takes Aggressive Stance on Tokens – Blockchain News, Opinion, TV and Jobs

✓ Share: