
Altcoin
Cosmos (ATOM) Elliott Wave Summary (2019

Cosmos ($ATOM) is the coin that powers the entire Cosmos ecosystem. It consists of a variety of projects from different spheres such as finance, decentralized exchanges (DEX), and cloud computing. The earliest price data I can find for $ATOM is from Kraken, starting in April 2019. Using this price data, the remainder of the article represents my best efforts to apply Elliott Wave Theory (EWT) to isolate its placement in market structures. I will assume that you have some knowledge of EWT to understand the terms, but I have also included a small glossary at the bottom for reference.
EWT Summary

Cosmos Price Data from Kraken | Source: ATOMUSD on tradingview.com.
Cycle Wave 0 – Mar 2020 – $1.1151
Primary Wave 1 – $2.4794
Primary Wave 2 – $1.8482 (38.2% LFR)
Primary Wave 3 – $32.2433 (3.618 LFE)
Primary Wave 4 – $7.872 (50% LFR)
Primary Wave 5 – $44.7383 (1.236 LFE)
Cycle Wave 1 – Sep 2021 – $44.7383
Primary Wave A – $20.2221 (Contracting, Leading Diagonal)
Primary Wave B – $33.2641 (Contracting Triangle)
Primary Wave C – $5.5409 (Impulse)
Cycle Wave 2 – Jun 2022 – $5.5409 (50% LFR)
Primary Wave 1 – ONGOING
Primary Wave 2 – TBA
Primary Wave 3 – TBA
Primary Wave 4 – TBA
Primary Wave 5 – TBA
Cycle Wave 3 – ONGOING
Exploring Further
EWT uses ratios to create price targets. The main target being the 1.618 LFE, however there are the minimum, lower, and much higher LFE’s to watch out for. For $ATOM we first need to find the beta multiple to scale the targets off of. This is accomplished by taking Wave 1 and dividing it by Wave 0. In this case for the Cycle Wave Degree it’s approximately 40.12. Then we raise this multiple to various numbers defined by EWT to create a table of targets. In order below are the LFE Price Targets:
0.618 – $54.26
1 – $222.3
1.236 – $531.3
1.618 – $2,176.84
Therefore, if we expect $ATOM to be a Diagonal then $54.26 – $222.3 is the preferred price box.
If we are looking for the typical price box then it’s: $531.3 – $2,176.84.
However, due to the nature of the next estimated bull run only the Intermediate Degree Wave 3 of the Cycle Wave 3 should play out. The next bull run is estimated by many traders and institutions to peak around late 2024 to early 2026. Benner Cycle Theory also puts a market peak around 2026. You can see the full layout for Benner’s Cycle Theory here. As such, the Intermediate Wave 1 and 2 are: $17.2656 and $6.17. The beta multiple for the Intermediate Degree is approximately 3.116. Then as we did for the Cycle Wave Degree the relevant typical price box is: $25.14 – $38.81. The higher price boxes are all above the ATH for $ATOM. The current price action for $ATOM is overwhelmingly bullish, so the higher price boxes are definitely a possibility.

Cosmos Price Data from MEXC | Source: ATOMUSD on tradingview.com.
Conclusion
Given the next bull run peak for crypto is likely late 2024 to early 2026 the relevant LFEs to use for $ATOM are at the Intermediate Wave Degree . The typical price targets for the Intermediate Degree Wave 3 are $25.14 – $38.81. The price as I write is $11.3 so the next peak is a rough 2 to 3.5x from here. If the Wave 3 is heavily extended and possibly goes to the 2.618 or 3.618 LFE then a new ATH is possible. That would mean a minimum of a 4x from here to the next peak. The Primary Wave 1 of Cycle Wave 3 is likely due in late 2026 to 2030 using Fibonacci Time Ratios.
Glossary
Elliott Wave Theory (EWT)
“A theory in technical analysis that attributes wave-like price patterns, identified at various scales, to trader psychology and investor sentiment.”
Source: “Elliott Wave Theory: What It Is and How to Use It” by James Chen (2023)
Logarithmic Fibonacci Retracement (LFR)
A measured correction at certain Fibonacci ratios on a semi-log scale.
Logarithmic Fibonacci Extensions (LFE)
A measured rally at certain Fibonacci ratios on a semi-log scale.
Supplemental Reading
“Elliott Wave Principle – Key To Market Behavior” by Frost & Prechter (2022)
“Visual Guide to Elliott Wave Trading” by Gorman & Kennedy (2013)
“How to Calculate Logarithmic Retracements and Extensions” by C. D. Chester (2023)
Disclaimer: The article is provided for educational purposes only. It does not represent the opinions of NewsBTC on whether to buy, sell or hold any investments and naturally investing carries risks. You are advised to conduct your own research before making any investment decisions. Use information provided on this website entirely at your own risk.
Source link


Recently, a popular crypto trader and YouTuber has predicted a substantial surge in Solana price, forecasting it could reach as high as $360 soon.
This prediction is underpinned by a technical pattern on Solana’s chart—a bullish signal suggesting a potential reversal from bearish to bullish momentum.
Technical Insights Into SOL Potential $360 Rise
According to the trader, CryptoJack on X, SOL has developed a “rounding bottom pattern” over an extended period, indicating it is on the brink of a significant breakout.
Notably, the ’rounding bottom’ pattern, characterized by a gradual decline followed by a stabilizing trend and an upward breakout, is a classic bullish indicator in technical analysis.
CryptoJack’s analysis points out that Solana is setting up for a significant uptick, aiming for a price target double its current value of approximately $146.
Solana formed a rounding bottom pattern over many weeks and is primed for an explosion any moment now.
I entered a Long position on $SOL and expect it to break ATHs this year! #Solana pic.twitter.com/ApUazaXXz5
— CryptoJack (@cryptojack) May 8, 2024
Not only does CryptoJack see a bright future for Solana, but other analysts, such as Altcoin Sherpa, also maintain a bullish stance, with projections of the token potentially surpassing $500 this year.
This would represent a 300% increase from its current level, adding to the 589% growth it has already achieved year-to-date.
Solana Challenges Ethereum
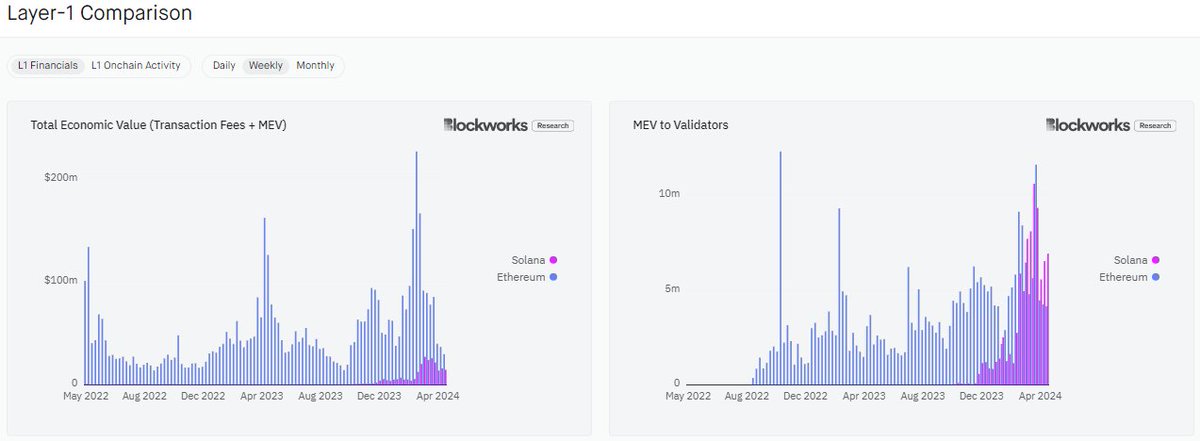
While Solana has shown notable growth, some of its key metrics are also beginning to keep up the pace. Dan Smith, a senior research analyst at Blockworks, suggests that Solana could soon surpass Ethereum regarding transaction fees and capture Maximal Extractable Value (MEV).
Smith’s analysis of X highlights that Solana’s total economic value is nearing Ethereum’s, indicating its increasing relevance in the blockchain space.
Solana will flip Ethereum in transaction fees + captured MEV this month, maybe even this week
— Dan Smith (@smyyguy) May 7, 2024
Despite this competition, Ethereum maintains a significant lead in daily transaction fees and total value locked (TVL). In the last 24 hours, Ethereum generated over $2.75 million in fees, compared to Solana’s $1.49 million.
Moreover, according to data from DeFillama, Ethereum’s TVL of over $53 billion dwarfs Solana’s $3.96 billion, representing just about 7.2% of Ethereum’s scale.
Meanwhile, Ethereum does not come close to Solana in terms of market performance. Solana has seen quite outstanding growth in the past year, surging by over 500%. On the other hand, Ethereum has only seen a 66% surge over the same period.
Featured image from Unsplash, Chart from TradingView
Disclaimer: The article is provided for educational purposes only. It does not represent the opinions of NewsBTC on whether to buy, sell or hold any investments and naturally investing carries risks. You are advised to conduct your own research before making any investment decisions. Use information provided on this website entirely at your own risk.
Source link

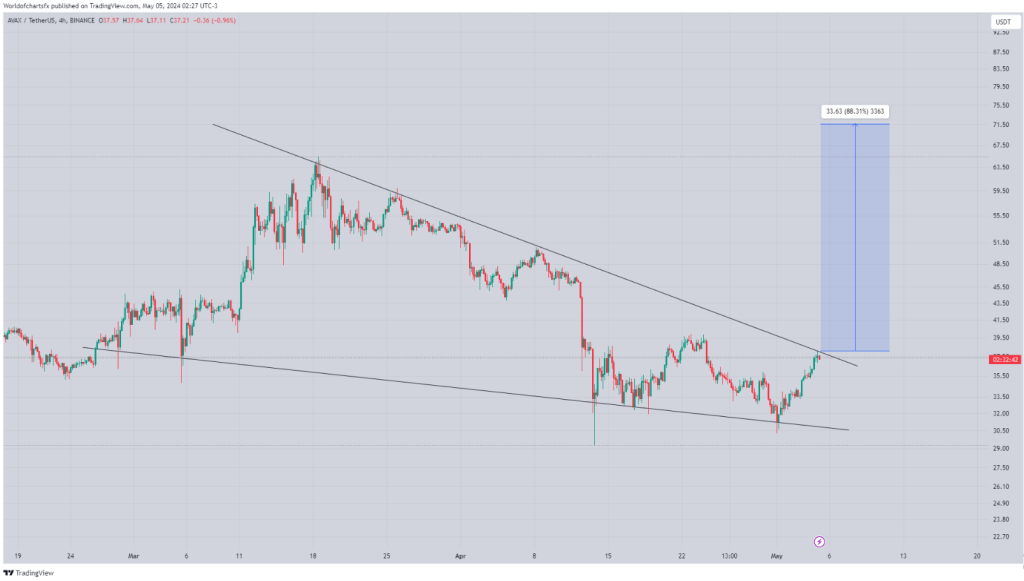
Smart contracts platform Avalanche (AVAX) is generating excitement in the crypto community with a potential breakout signal. Prominent analyst World of Chart has identified a bullish technical pattern that could propel AVAX prices significantly higher in the coming days.
Falling Wedge Pattern Hints At Upside
World of Chart points to the presence of a “falling wedge” pattern on AVAX’s price chart. This pattern typically forms during a consolidation phase, with price action confined between two converging trendlines that slope downwards.
Forming Falling Wedge Incase Of Breakout Expecting Upside Continuation Successful Breakout Can Lead Massive Rally In Coming Days#Crypto #Avax pic.twitter.com/YJHJYarrSw
— World Of Charts (@WorldOfCharts1) May 5, 2024
The key aspect of this pattern lies in the diminishing price range within the wedge, suggesting a buildup of buying pressure. A breakout from the upper trendline is often interpreted as a bullish signal, indicating a potential reversal of the downtrend and the start of a price surge.
Avalanche Poised For Takeoff?
AVAX might see a significant upswing if it is able to break above the upper trendline of the falling wedge, according to World of Chart.
Following the breakout, there may be a substantial price increase as a result of this ascent, which would confirm the bullish formation. The expert draws attention to the possibility of significant momentum and an explosive upward advance.
Total crypto market cap currently at $2.3 trillion. Chart: TradingView
The possibility of an AVAX breakout has ignited discussions and speculation among crypto investors and traders, particularly those who actively follow technical analysis.
Investor Caution Advised Despite Bullish Outlook
While the potential for a bullish breakout is high, World of Chart emphasizes the inherent volatility and uncertainty of the cryptocurrency market. External factors beyond technical analysis can significantly impact price movements.
Technical Indicators Paint A Positive Picture
Beyond the falling wedge pattern, other technical indicators seem to be adding weight to the bullish narrative for AVAX. The recent price increase of over 16% in a single week suggests a potential shift in investor sentiment.
Additionally, the impressive surge in trading volume signifies heightened market activity and growing investor interest in AVAX.
Source: Coingecko
Eyes On The Prize: Will Avalanche Deliver?
The coming days will be crucial, with all eyes glued to the price action and any signs of a breakout. A successful breakout could lead to significant gains for AVAX holders, while a failed breakout could dampen investor enthusiasm.
Featured image from Pexels, chart from TradingView
Disclaimer: The article is provided for educational purposes only. It does not represent the opinions of NewsBTC on whether to buy, sell or hold any investments and naturally investing carries risks. You are advised to conduct your own research before making any investment decisions. Use information provided on this website entirely at your own risk.
Source link
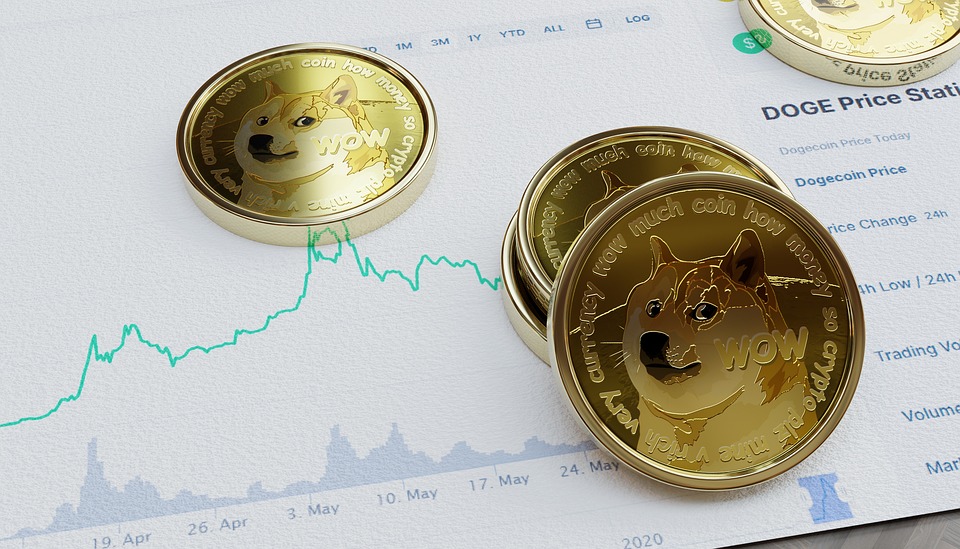
Dogecoin (DOGE), the Shiba Inu-faced darling of the 2021 memecoin frenzy, has found itself shivering in the current crypto winter. Once a symbol of retail investor exuberance, DOGE has plummeted over 70% from its sky-high peak, leaving its future shrouded in uncertainty.
DOGE Feels The Crypto Frost
While Bitcoin, the heavyweight champion of the crypto world, grabs headlines with its recent wobble, the impact on memecoins like DOGE has been brutal. Unlike Bitcoin’s divided analyst opinions, the sentiment surrounding DOGE is decidedly bearish.
At the time of writing, the memecoin was trading at $0.132, down 5.4% up the last 24 hours but sustained a 20% loss in the last seven days, data from Coingecko shows.
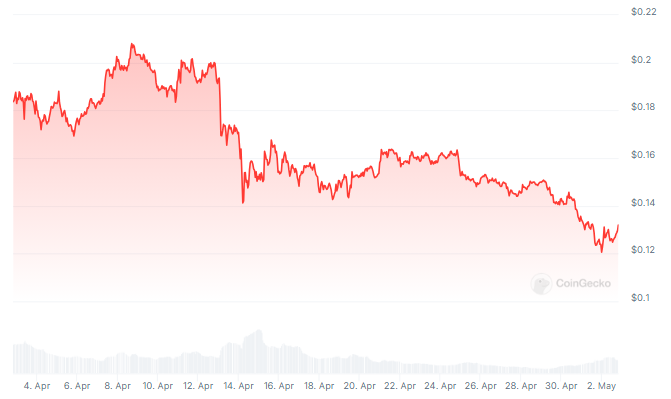
Dogecoin price action in the last 30 days. Source: Coingecko
Is DOGE A Canary In The Crypto Coal Mine?
Some analysts believe DOGE’s struggles are a canary in the coal mine for the entire crypto market. They said if even a historically high-flying memecoin like Dogecoin can’t hold onto gains, it raises serious concerns about risk appetite in the crypto space in general.
Dogecoin market cap currently at $18 billion. Chart: TradingView.com
Whales Accumulating DOGE: A Glimmer Of Hope?
However, a glimmer of hope flickers for the dethroned meme king. On-chain data suggests an increase in large wallet purchases of DOGE, hinting at potential accumulation by wealthy investors. This “contrarian” behavior could be a sign that some whales are using Coinglass or similar platforms to track Dogecoin derivatives and believe the coin is undervalued and ripe for a comeback.
Source: Coinglass
Coinglass, a popular cryptocurrency data provider, offers insights into factors that might be influencing the whales’ decisions. By analyzing metrics like open interest, funding rates, and liquidations on Coinglass, these investors might see an opportunity to buy DOGE at a discount.
Related Reading: Solana Crawls: Network Update Fails To Fix Traffic Jam, Price Feels The Pinch
In a similar development, Whale Alert, a well-known blockchain tracker, has reported that a DOGE whale arranged two large transactions in a single day. Some 150,000,000 Dogecoins were transferred in the first transaction, and an additional 76,316,694 DOGE were transferred in the second, for a total of almost 226 million DOGE. At the time, the meme cryptocurrency was worth around $40 million in fiat money.
🚨 150,000,000 #DOGE (21,281,922 USD) transferred from #Robinhood to unknown wallethttps://t.co/7U1CEfr2ZT
— Whale Alert (@whale_alert) April 29, 2024
Can Dogecoin Thaw The Crypto Winter?
The coming weeks will be critical for DOGE. The return of positive social media sentiment, coupled with continued accumulation by whales who might be strategically using Coinglass for market analysis, could be the spark that reignites the DOGE rally. However, if the broader market weakness persists, DOGE’s summer might be spent shivering in the doghouse.
Featured image from Pixabay, chart from TradingView
Disclaimer: The article is provided for educational purposes only. It does not represent the opinions of NewsBTC on whether to buy, sell or hold any investments and naturally investing carries risks. You are advised to conduct your own research before making any investment decisions. Use information provided on this website entirely at your own risk.
Source link

Insight Into The Timing And Factors

Bitcoin About To ‘Blow Higher’ Despite This Week’s Pullback, According to Glassnode Co-Founders – Here’s Why

Azuro and Chiliz Working Together to Boost Adoption of Onchain Sport Prediction Markets – Blockchain News, Opinion, TV and Jobs

Robinhood Bleeds 164 Million Dogecoin

AIGOLD Goes Live, Introducing the First Gold Backed Crypto Project – Blockchain News, Opinion, TV and Jobs

Analyst Benjamin Cowen Warns Ethereum ‘Still Facing Headwinds,’ Says ETH Will Only Go Up if Bitcoin Does This

Tron Price Prediction: TRX Outperforms Bitcoin, Can It Hit $0.132?

Ethereum-Based Altcoin Leads Real-World Assets Sector in Development Activity, According to Santiment

Here’s Why This Analyst Is Predicting A Rise To $360

Hackers With $182,000,000 Stolen From Poloniex Starts Moving Funds to Tornado Cash

Cardano Faces Make-Or-Break Price Level For Bullish Revival

A Premier Crypto Exchange Tailored for Seasoned Traders – Blockchain News, Opinion, TV and Jobs

Crypto Whale Withdraws $75.8 Million in USDC From Coinbase To Invest In Ethereum’s Biggest Presale – Blockchain News, Opinion, TV and Jobs

CFTC Chair Says ‘Another Cycle of Enforcement Actions’ Coming As Crypto Enters New Phase of Asset Appreciation

Spectral Labs Joins Hugging Face’s ESP Program to advance the Onchain x Open-Source AI Community – Blockchain News, Opinion, TV and Jobs

Bitcoin Dropped Below 2017 All-Time-High but Could Sellers be Getting Exhausted? – Blockchain News, Opinion, TV and Jobs

What does the Coinbase Premium Gap Tell us about Investor Activity? – Blockchain News, Opinion, TV and Jobs
BNM DAO Token Airdrop

NFT Sector Keeps Developing – Number of Unique Ethereum NFT Traders Surged 276% in 2022 – Blockchain News, Opinion, TV and Jobs
New Minting Services

Block News Media Live Stream
A String of 200 ‘Sleeping Bitcoins’ From 2010 Worth $4.27 Million Moved on Friday

SEC’s Chairman Gensler Takes Aggressive Stance on Tokens – Blockchain News, Opinion, TV and Jobs

Friends or Enemies? – Blockchain News, Opinion, TV and Jobs

Enjoy frictionless crypto purchases with Apple Pay and Google Pay | by Jim | @blockchain | Jun, 2022

Block News Media Live Stream

How Web3 can prevent Hollywood strikes

Block News Media Live Stream

XRP Explodes With 1,300% Surge In Trading Volume As crypto Exchanges Jump On Board
Block News Media Live Stream
 Altcoins2 years ago
Bitcoin Dropped Below 2017 All-Time-High but Could Sellers be Getting Exhausted? – Blockchain News, Opinion, TV and Jobs
 Binance2 years ago
What does the Coinbase Premium Gap Tell us about Investor Activity? – Blockchain News, Opinion, TV and Jobs
- Uncategorized2 years ago
BNM DAO Token Airdrop
 BTC1 year ago
NFT Sector Keeps Developing – Number of Unique Ethereum NFT Traders Surged 276% in 2022 – Blockchain News, Opinion, TV and Jobs
- Uncategorized3 years ago
New Minting Services
 Video2 years ago
Block News Media Live Stream

 Bitcoin miners2 years ago
A String of 200 ‘Sleeping Bitcoins’ From 2010 Worth $4.27 Million Moved on Friday
 Bitcoin1 year ago
SEC’s Chairman Gensler Takes Aggressive Stance on Tokens – Blockchain News, Opinion, TV and Jobs
