
All
Parabolic Bitcoin Indicator Points To Continued Bull Run Despite 15% Crash
Recently, Bitcoin experienced a significant drop, crashing 15% from its 2024 highs around $49,000. This decline followed closely on the heels of the approval of 11 spot Bitcoin Exchange-Traded Funds (ETFs), a move that was initially met with optimism in the crypto community. The sudden downturn has left investors and traders analyzing the charts for clues about Bitcoin’s next move.
Is The Bullish Bitcoin Trend Over?
In the wake of this decline, technical analysis offers a beacon of insight. Notably, the correction was marked by a bearish engulfing candle on the daily chart, signaling a potential reversal in Bitcoin’s upward trend.
Accompanying this was a nasty wick – a long upper shadow on the candlestick chart, indicating a significant sell-off after prices peaked.
Further complicating the landscape was the opening of the CME BTC Futures with a sizeable gap down. Such gaps are often viewed as potential resistance levels, reinforcing the bearish sentiment.
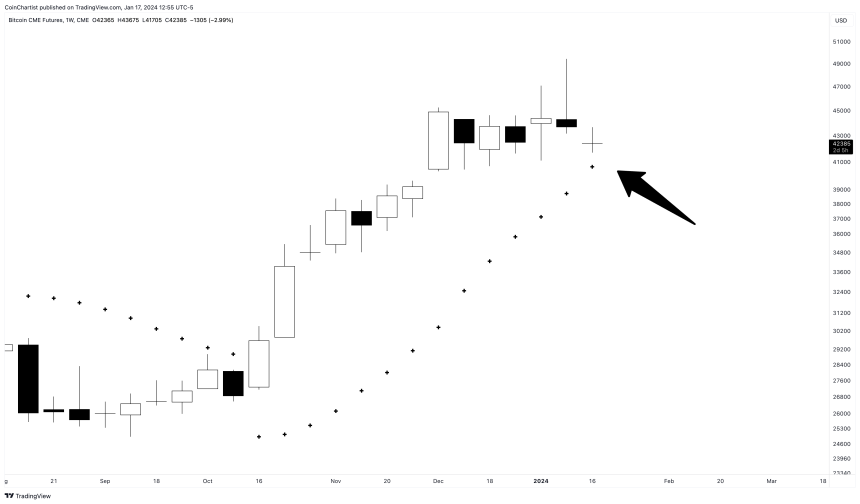
The Parabolic SAR remains below price action | BTCUSD on TradingView.com
Stop And Reverse: A Ray Of Hope
However, amidst these seemingly negative signals, a ray of hope shines through from a “parabolic” technical indicator – the Parabolic SAR (Stop and Reverse).
Despite the tumultuous market conditions, the weekly BTCUSD Parabolic SAR indicator remains untagged, suggesting that the long-term uptrend is still intact.
This indicator, known for its effectiveness in identifying potential reversals in the market’s direction, paints a different picture from the immediate bearish signals and sentiment.
What Is The Parabolic SAR?
To fully grasp the significance of the Parabolic SAR in this context, it’s essential to understand what it is and how it functions. The Parabolic SAR is a popular technical analysis tool used primarily to determine the direction of an asset’s momentum and to provide entry and exit points.
The ‘SAR’ in Parabolic SAR stands for ‘Stop and Reverse.’ This indicator is represented on charts as a series of dots placed either above or below the price bars. A dot placed below the price is viewed as a bullish signal, while a dot above is bearish.
The unique aspect of the Parabolic SAR is its ability to act as a trailing stop loss. As the price of an asset moves, the Parabolic SAR adjusts, moving closer to the price line. This adjustment provides a dynamic method for traders to manage their positions, securing profits while limiting potential losses.
In the context of Bitcoin’s current situation, the Parabolic SAR’s position – still below the price bars on the weekly chart – suggests that the long-term bullish trend is not yet disrupted.
Disclaimer: The article is provided for educational purposes only. It does not represent the opinions of NewsBTC on whether to buy, sell or hold any investments and naturally investing carries risks. You are advised to conduct your own research before making any investment decisions. Use information provided on this website entirely at your own risk.
Source link

INJ, the native token of the Injective Network, commenced May with a fluctuating price action marked by a series of significant losses and gains. As INJ attempts to establish a stable price trajectory, popular market analyst with X handle Crypto Tony has highlighted a pivotal support zone for the altcoin in the coming weeks.
INJ Must Not Fall Below $19.30 Level, Analyst Warns
In an X post on Friday, Crypto Tony shared a vital insight on the INJ market which could create a sentiment of caution among many traders. The renowned analyst stated that INJ must maintain a market price above the $19.30 price zone, warning that a dip below this support level could spell danger for investors.
While Crypto Tony did not say the extent of this danger, the possible loss seems to be likely massive as his statements implied the INJ bull traders could struggle to re-establish market control should the token’s price fall below the specified threshold. Furthermore, the analyst stated that early investors of INJ including himself would be immune to this potential downside. However, he still plans to pull out of the Injective market should the token lose its $19.30 support zone.
Currently, INJ trades around $24.70 reflecting a gain of 4.68% in the last day after a period of intense market volatility. The altcoin appears to be gathering momentum for a bullish trend following negative performances in recent weeks resulting in a decline of 24.07% in the last 30 days.
What’s Next For Injective?
With respect to a highly anticipated crypto bull run, INJ, which gained by over 3,000% in 2023, has been marked by several analysts as one potentially favorable altcoin for investment in the coming weeks.
Interestingly, these sentiments have been bolstered in recent weeks by a series of positive developments on the Injective network. For instance, Injective recorded 2.4 million transactions in a single day marking a new milestone in daily transactions for the Layer 1 network.
In particular, the Injective 3.0 network upgrade has also been recently approved which is expected to tackle the inflationary problems of the INJ by decreasing the token’s minimum and maximum creation rate by 25% and 30%, respectively over the next two years on a uniform quarterly basis.
Through these deflationary measures, it is expected that INJ would experience an increased scarcity which could, in turn, drive up the altcoin’s market value, thus contributing to a positive performance in the expected crypto bull run. However, investors are reminded that all cryptocurrencies are subject to varying levels of market volatility and are admonished to trade with all necessary caution.
 INJ trading at $24.66 on the daily chart | Source: INJUSDT chart on Tradingview.com
Featured image from iStockphoto, chart from Tradingview
Disclaimer: The article is provided for educational purposes only. It does not represent the opinions of NewsBTC on whether to buy, sell or hold any investments and naturally investing carries risks. You are advised to conduct your own research before making any investment decisions. Use information provided on this website entirely at your own risk.
Source link

XRP continues to show strength despite largely underperforming during the ongoing bull market. Interestingly, the crypto witnessed a surge in activity last week, with trading volume surging in tandem. Particularly, the trading volume saw an increase of over 80% recently.
However, the boost in activity and trading volume has not necessarily translated into continuous price growth, as XRP is currently on a 13% percent correction from the $0.74 price level on Monday.
XRP Trading Volume Surges, But Will Price Follow?
XRP witnessed a surge earlier in the week which saw it breaking out of a 6-year-long symmetrical triangle, prompting analysts to anticipate a continued price surge.
During this period, the crypto witnessed a surge in trading volume from whales in particular, with large bouts of XRP leaving crypto exchanges.
This bullish sentiment allowed XRP to cross over $0.74 for the first time in eight months, albeit for a short moment. This surge in price was short-lived, as XRP fell as low as $0.6 in the days after.
However, a recent 80% surge in on-chain activity and trading volume has led to the price of XRP increasing by 4.45% in the past 24 hours and 2.2% in a seven-day timeframe.
Volume spikes of this magnitude often occur before a price rally, therefore, this massive spike in volume has the XRP community speculating that a strong price rally could be on the horizon.
Total crypto market cap currently at $2.5 trillion. Chart: TradingView
Current Price Action: Can XRP Reach A New All-Time High?
At the time of writing, XRP is trading at $0.6398. The crypto’s journey to a new all-time high is definitely not going to be an easy one, as it is now down by 83% from its current all-time high of $3.84.
However, current market dynamics and various predictions from many crypto analysts indicate that the crypto might go on a surge of great magnitude in the near future.
One of these is a prediction from analyst Jaydee, who noted that XRP’s recent breakout from the six-year trendline mentioned earlier could lead to a surge to $3 from the current price level.
The major resistance level to watch is $0.74. XRP tested this level a few days ago but failed to close above it. If bullish momentum continues and volume stays strong, XRP could break through $0.74 decisively in the new week. If it does, the next resistance levels are at $0.82 and $1.5.
One of the few factors that could contribute to a strong price increase is regulatory clarity regarding XRP’s status, which could boost confidence from institutional investors.
Notably, XRP’s non-security status seems to be gaining ground. The European Corporate Governance Institute (ECGI) recently published a research paper acknowledging this non-security status.
Featured image from Pexels, chart from TradingView
Disclaimer: The article is provided for educational purposes only. It does not represent the opinions of NewsBTC on whether to buy, sell or hold any investments and naturally investing carries risks. You are advised to conduct your own research before making any investment decisions. Use information provided on this website entirely at your own risk.
Source link

The Bitcoin community is currently abuzz with discussions of an impending supply shock, a market phenomenon where demand outstrips supply, potentially leading to a substantial price increase. Indicators from various sectors within the market are currently converging, suggesting that such an event may be closer than many anticipate. Here’s an in-depth look at three signs for an impending supply shock:
#1 Surging Demand For Bitcoin ETFs
Bitcoin ETFs have been creating an exceptionally large demand since their launch. Initially, this demand surge was somewhat moderated due to significant outflows from the Grayscale Bitcoin ETF (GBTC). However, day 13 of the Bitcoin ETFs showed once again that the Grayscale outflows are slowly slowing down (yesterday: $220.7 million, previously $191.7 million), while the last two trading days saw net inflows for all ETF issuers of around $250 million.
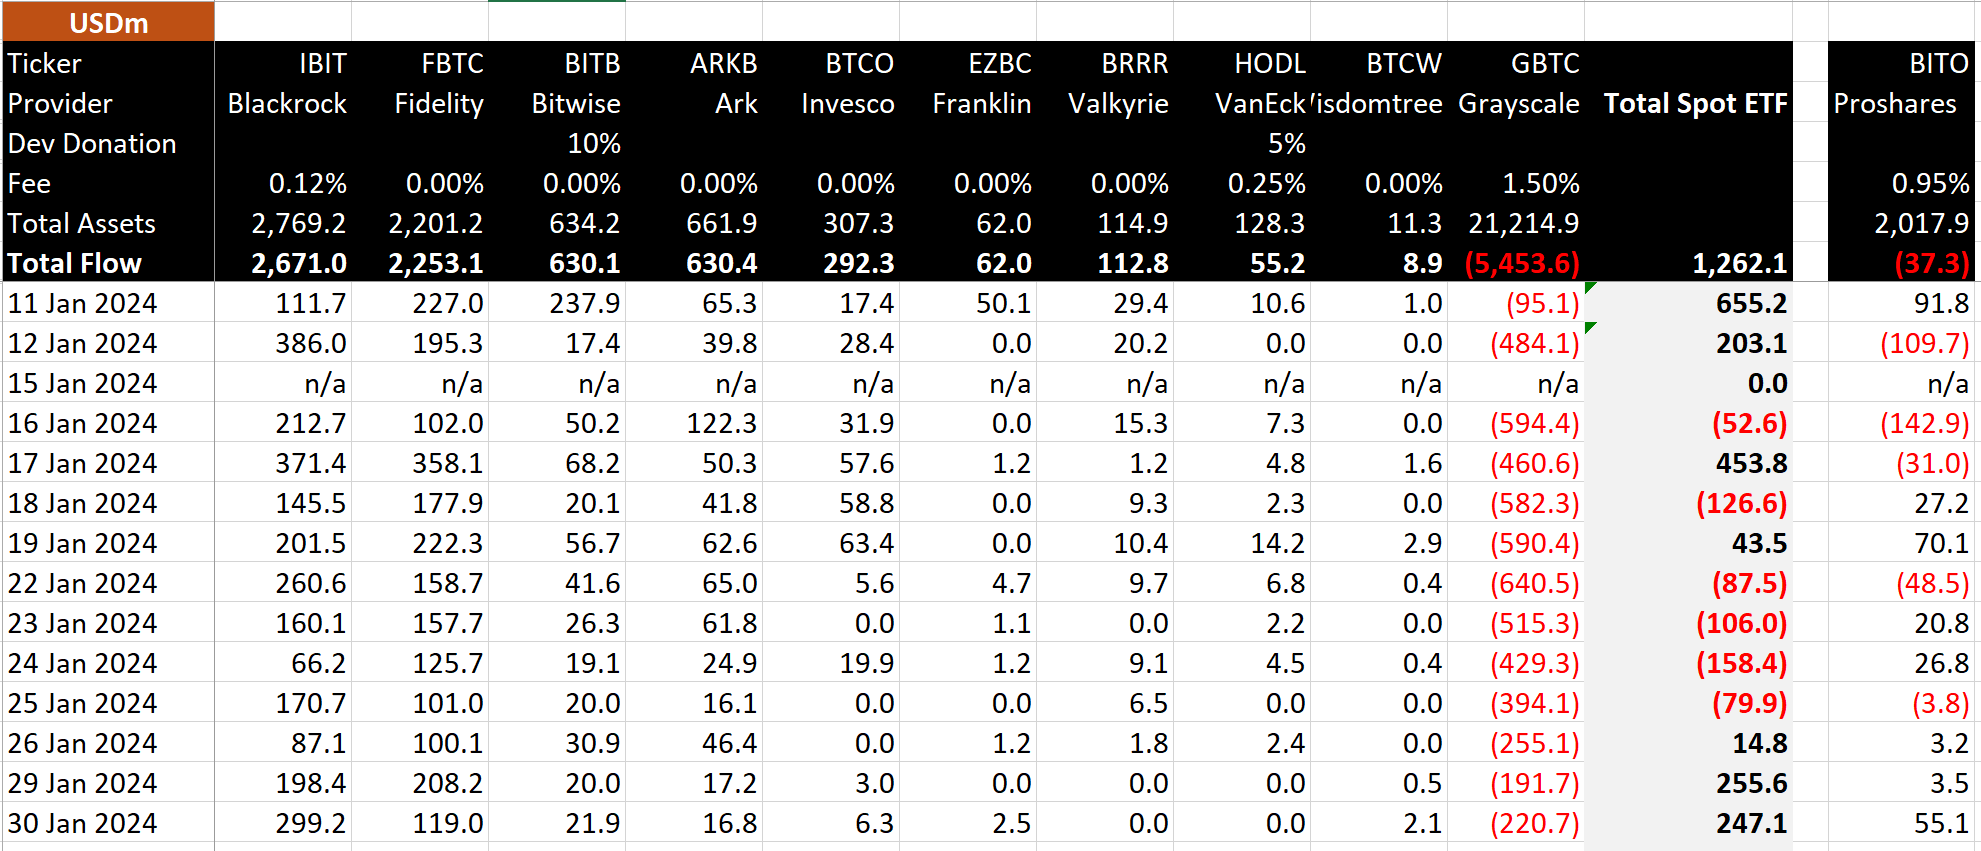
Dan Ripoll, managing director at Swan, provided a detailed analysis on the sheer magnitude of this. “The Bitcoin spot ETFs have already snatched up 150,500 BTC in just 13 trading days. They are buying at a rate of 12,000 BTC per day. Now, let’s KISS (keep it simple stupid). There are only 900 BTC per day being issued. BTC is being bought up at a rate of 13x daily issuance. In 3 months, the issuance will be cut in half, driving the demand/supply imbalance to a staggering 26x daily issuance!”
Furthermore, Alessandro Ottaviani, a respected Bitcoin analyst, underscored the potential market shift, stating, “Now that the Bitcoin ETF inflow will always be higher than the Grayscale outflow, the only way to accommodate that demand will be through an increase of price. Once we reach $60k and even more after the new ATH, Institutional FOMO will be officially triggered, and it will be something that the human being has never experienced.”
WhalePanda, a renowned crypto analyst, highlighted recent activities, adding credibility to the brewing supply shock: “Yesterday another ~$250 million net inflow into Bitcoin ETFs with Blackrock doing a solid $300 million all by itself. Two days of $250 million inflow, the price didn’t rally much yesterday, but a couple of days like this, and you’ll see what kind of supply shock this will have on BTC.”
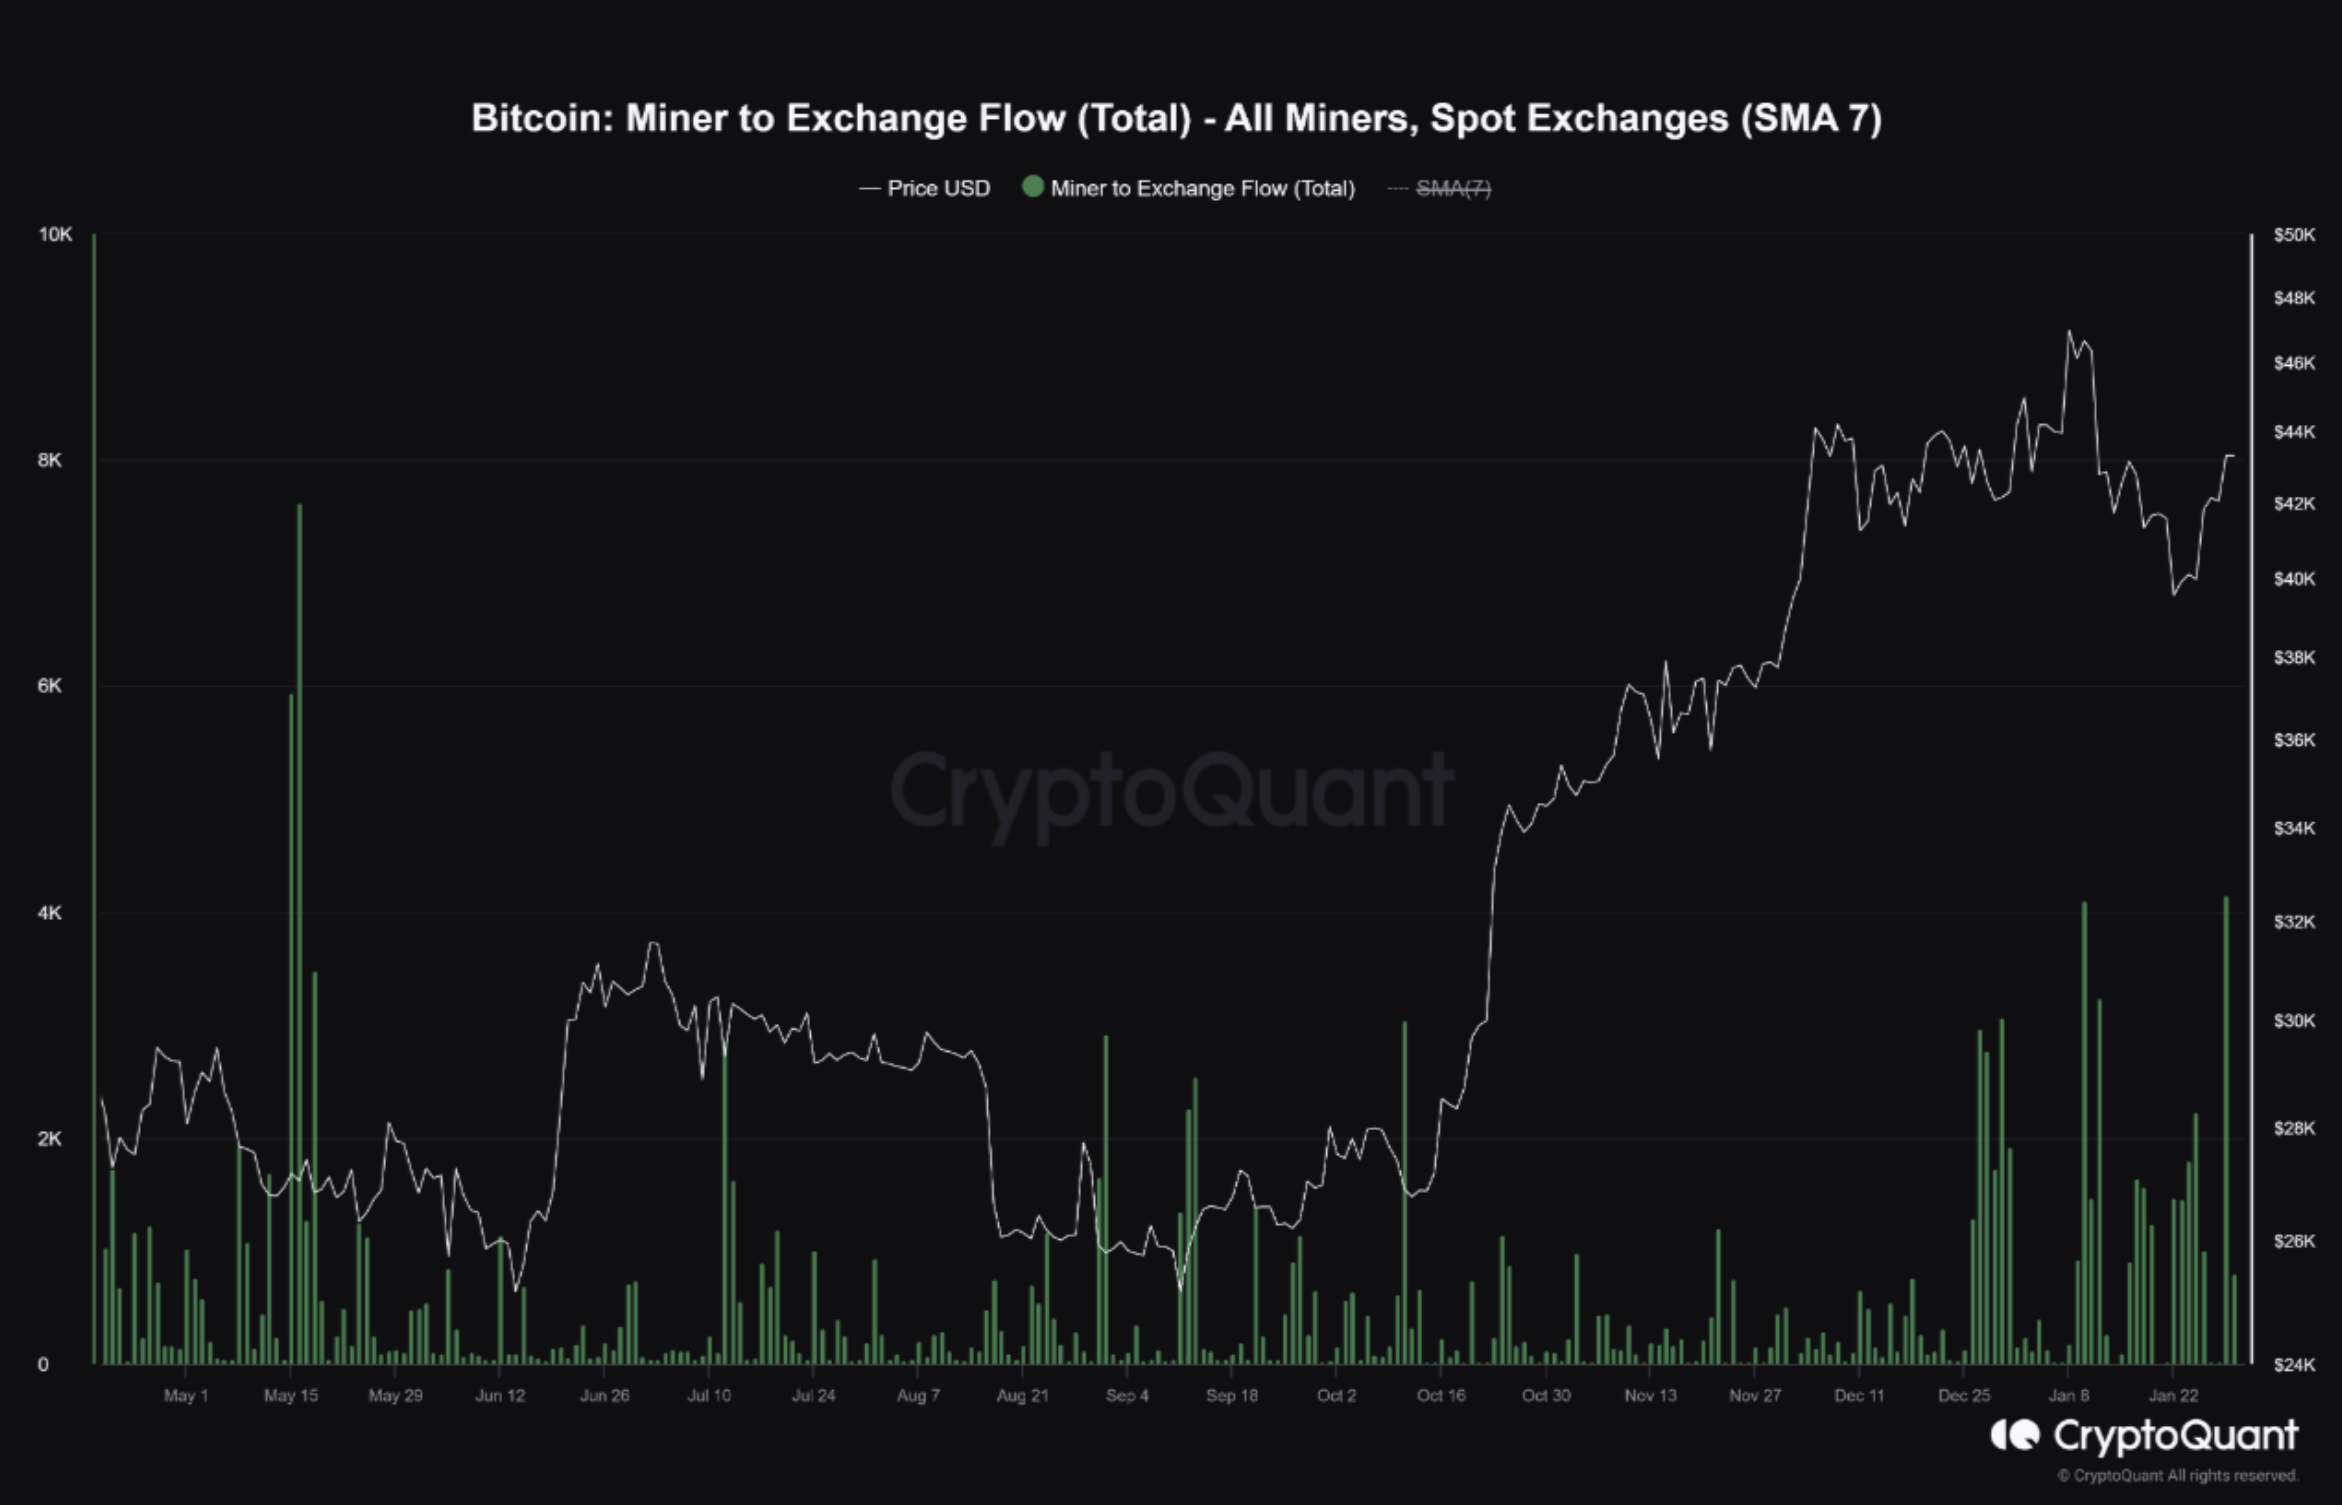
#2 Massive Bitcoin Miner Selling Absorbed
Despite a substantial flow of coins from miner wallets to spot exchanges, the market has shown remarkable resilience. According to a report from Cryptoquant:
“Yesterday, the flow of coins in miner wallets going to spot exchanges recorded the highest value since May 16, 2023. In total, more than 4,000 Bitcoins flowed to spot exchanges, around $173 million in selling pressure. However, this selling pressure was calmly absorbed by the market.”
It’s critical to note that despite these interactions, the reserves in mining portfolios have remained consistent since the beginning of January, indicating that the market has effectively absorbed the selling pressure without significant price depreciation.
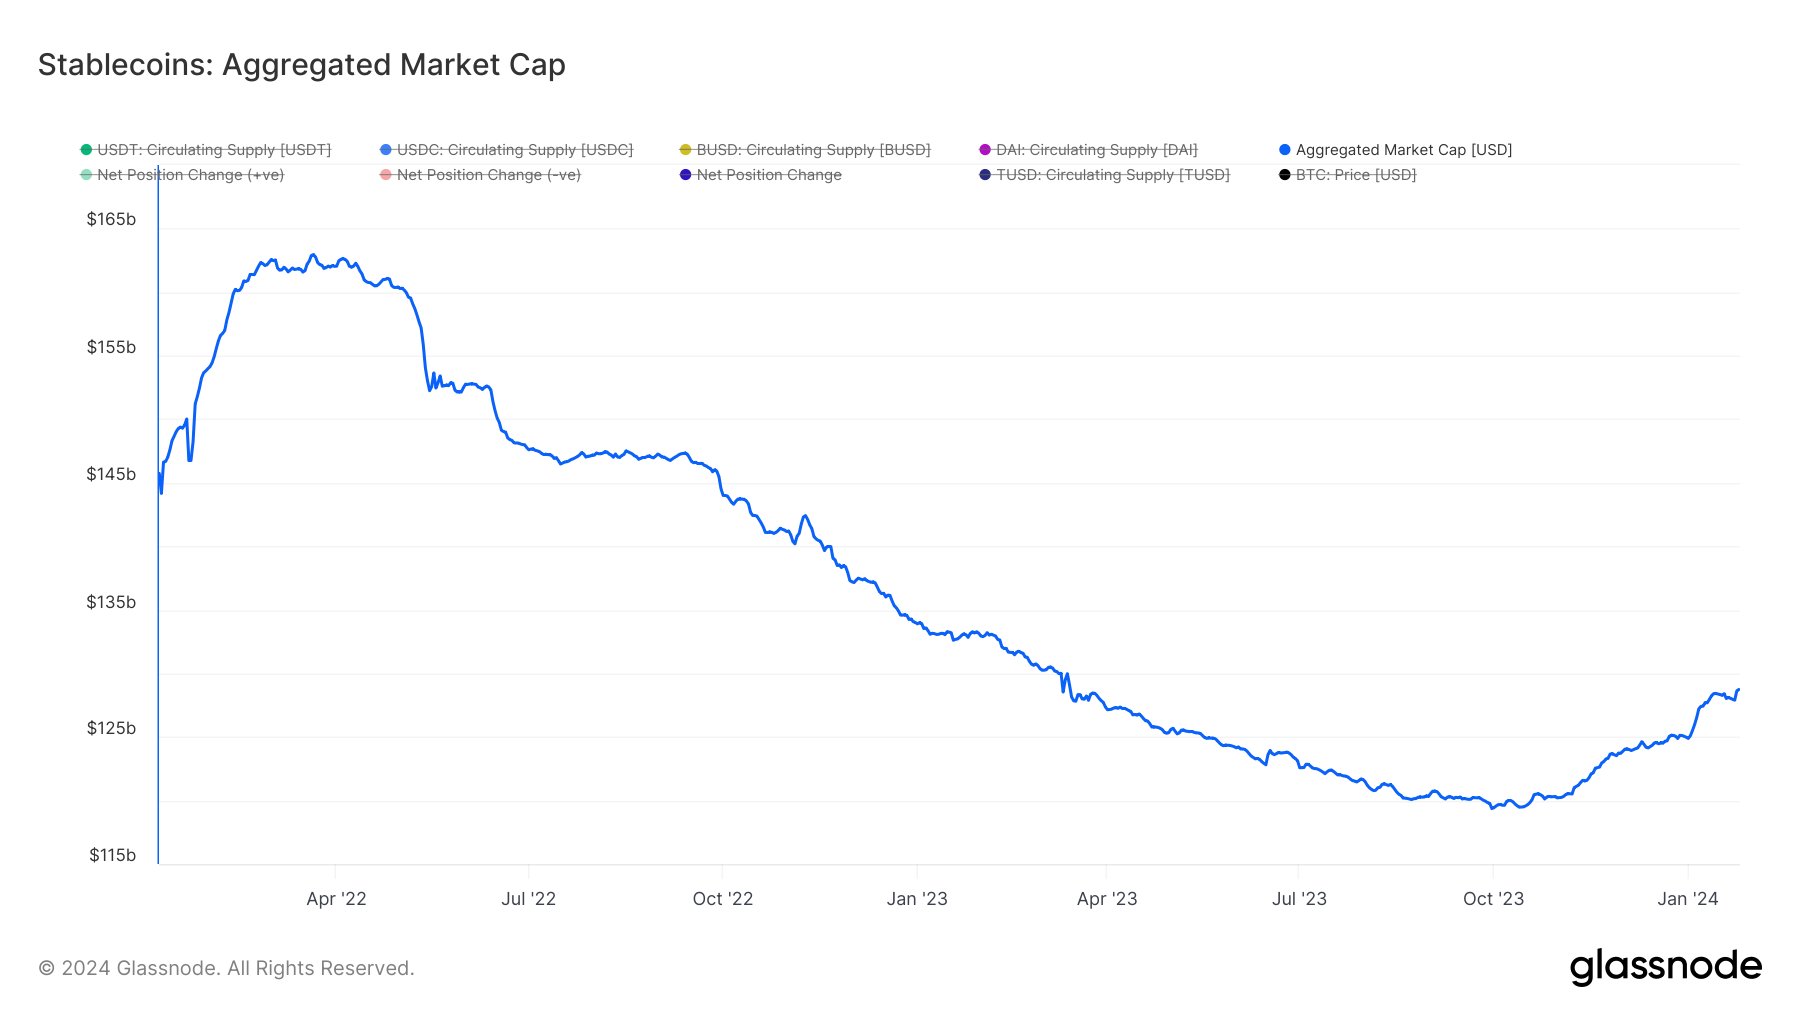
#3 Stablecoins Aka “Dry Powder” On The Rise
The stablecoin aggregated market cap serves as a precursor to potential market movements. Recently, the stablecoin aggregated market cap has shown a significant rebound, moving from a bottom of $119.5 billion in mid-October 2023 to nearing $130 billion.
This rise in stablecoin reserves is often interpreted as “dry powder,” ready to be deployed into assets like Bitcoin, potentially further accelerating the supply/demand mechanics. Alex Svanevik, founder of on-chain analysis platform Nansen, remarked on the correlation between stablecoin reserves and BTC price: “When stables on exchanges peaked, BTC price peaked.”
At press time, BTC traded at $42,848.
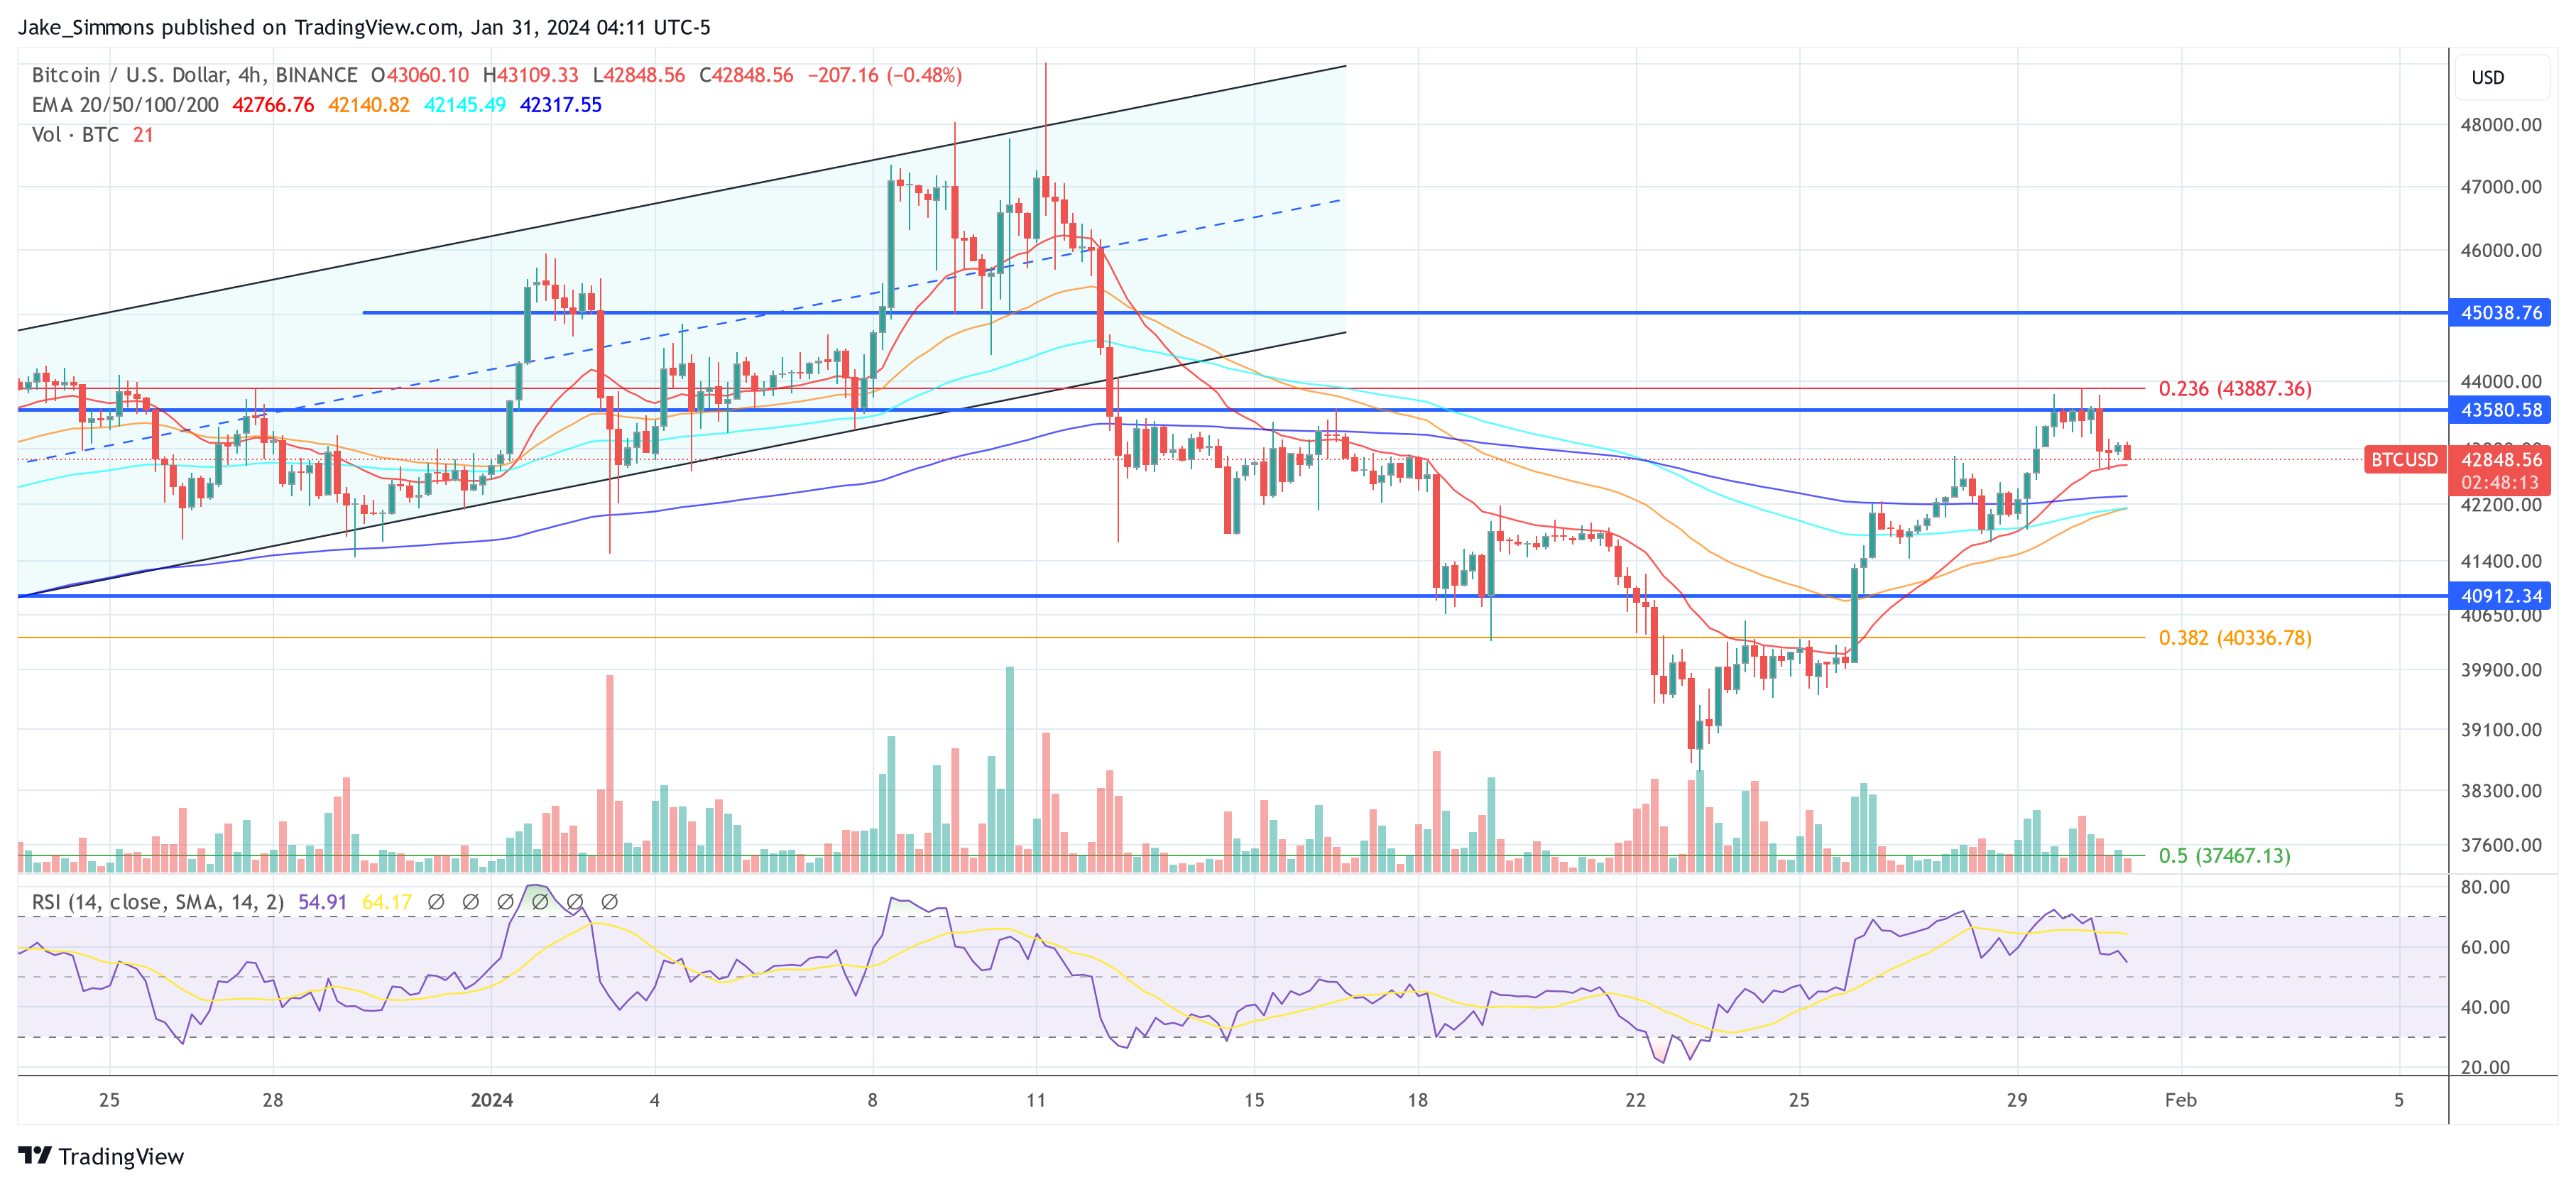
Featured image created with DALL·E, chart from TradingView.com
Disclaimer: The article is provided for educational purposes only. It does not represent the opinions of NewsBTC on whether to buy, sell or hold any investments and naturally investing carries risks. You are advised to conduct your own research before making any investment decisions. Use information provided on this website entirely at your own risk.
Source link

Insight Into The Timing And Factors

Bitcoin About To ‘Blow Higher’ Despite This Week’s Pullback, According to Glassnode Co-Founders – Here’s Why

Azuro and Chiliz Working Together to Boost Adoption of Onchain Sport Prediction Markets – Blockchain News, Opinion, TV and Jobs

Robinhood Bleeds 164 Million Dogecoin

AIGOLD Goes Live, Introducing the First Gold Backed Crypto Project – Blockchain News, Opinion, TV and Jobs

Analyst Benjamin Cowen Warns Ethereum ‘Still Facing Headwinds,’ Says ETH Will Only Go Up if Bitcoin Does This

Tron Price Prediction: TRX Outperforms Bitcoin, Can It Hit $0.132?

Ethereum-Based Altcoin Leads Real-World Assets Sector in Development Activity, According to Santiment

Here’s Why This Analyst Is Predicting A Rise To $360

Hackers With $182,000,000 Stolen From Poloniex Starts Moving Funds to Tornado Cash

Cardano Faces Make-Or-Break Price Level For Bullish Revival

A Premier Crypto Exchange Tailored for Seasoned Traders – Blockchain News, Opinion, TV and Jobs

Crypto Whale Withdraws $75.8 Million in USDC From Coinbase To Invest In Ethereum’s Biggest Presale – Blockchain News, Opinion, TV and Jobs

CFTC Chair Says ‘Another Cycle of Enforcement Actions’ Coming As Crypto Enters New Phase of Asset Appreciation

Spectral Labs Joins Hugging Face’s ESP Program to advance the Onchain x Open-Source AI Community – Blockchain News, Opinion, TV and Jobs

Bitcoin Dropped Below 2017 All-Time-High but Could Sellers be Getting Exhausted? – Blockchain News, Opinion, TV and Jobs

What does the Coinbase Premium Gap Tell us about Investor Activity? – Blockchain News, Opinion, TV and Jobs
BNM DAO Token Airdrop

NFT Sector Keeps Developing – Number of Unique Ethereum NFT Traders Surged 276% in 2022 – Blockchain News, Opinion, TV and Jobs
New Minting Services

Block News Media Live Stream
A String of 200 ‘Sleeping Bitcoins’ From 2010 Worth $4.27 Million Moved on Friday

SEC’s Chairman Gensler Takes Aggressive Stance on Tokens – Blockchain News, Opinion, TV and Jobs

Friends or Enemies? – Blockchain News, Opinion, TV and Jobs

Enjoy frictionless crypto purchases with Apple Pay and Google Pay | by Jim | @blockchain | Jun, 2022

Block News Media Live Stream

How Web3 can prevent Hollywood strikes

Block News Media Live Stream

XRP Explodes With 1,300% Surge In Trading Volume As crypto Exchanges Jump On Board
Block News Media Live Stream
 Altcoins2 years ago
Bitcoin Dropped Below 2017 All-Time-High but Could Sellers be Getting Exhausted? – Blockchain News, Opinion, TV and Jobs
 Binance2 years ago
What does the Coinbase Premium Gap Tell us about Investor Activity? – Blockchain News, Opinion, TV and Jobs
- Uncategorized2 years ago
BNM DAO Token Airdrop
 BTC1 year ago
NFT Sector Keeps Developing – Number of Unique Ethereum NFT Traders Surged 276% in 2022 – Blockchain News, Opinion, TV and Jobs
- Uncategorized3 years ago
New Minting Services
 Video2 years ago
Block News Media Live Stream

 Bitcoin miners2 years ago
A String of 200 ‘Sleeping Bitcoins’ From 2010 Worth $4.27 Million Moved on Friday
 Bitcoin1 year ago
SEC’s Chairman Gensler Takes Aggressive Stance on Tokens – Blockchain News, Opinion, TV and Jobs
