
M&A
Solana (SOL) Continues To Soar

The Solana network’s native cryptocurrency, SOL, has been on an upward surge in the past three days, climbing from around $180 to over $210.
Having failed to break its previous low of $162.74, the coin, which is currently ranked 5th in the crypto market with a total supply of 441 million and a market capitalization of over $88 billion, SOL is showing no signs of stopping.
Will Solana Continue To Surge Upward?
At the time of writing, Solana has been up by 6.25% trading around $198 in the past 24 hours, and has broken above the previous resistance level of $195. The price is also trading above the 100-day moving average on the 4-hour chart of the SOL/USD pair. If the price continues to move upward, it might break above its major resistance level of $210 and move even higher to create a new high for the year.
All these can be seen in the image below:
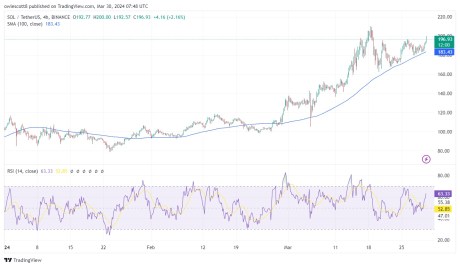
Looking at the chart with the help of the RSI (Relative Strength Index) indicator in the image above, we can see that the RSI line is trending above the 50 level. This is an indication that the price of SOL is still in a bullish zone and could even surge further upward.
A further look at the 4-hour timeframe chart with the help of the MACD indicator, we can see that the MACD is on the bullish side as the MACD line, the signal line, and the MACD histogram are all trending above the zero line.
Finally, using the bull vs bear power histogram indicator, it appears buyers have taken over the market with powerful momentum and are ready to push the price even higher.
We can confirm this in the image below:
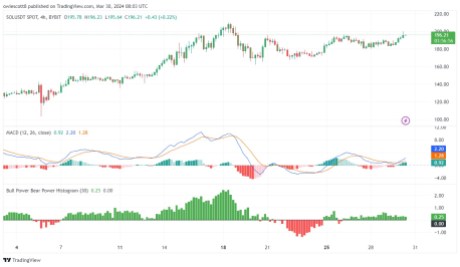
With the momentum that Solana is moving with, there is a possibility that it could break above its previous resistance level of $210.27. If this manages to happen we could see prices soaring higher especially with the level of demand momentum in the market
Could SOL Dip?
If the price of Solana fails to break above the resistance level of $210, it could start a downside correction to its initial support level of 162. If the price closes below this support level, it could decline even further and probably start a downward trend.
Featured image from YouTube, chart from Tradingview.com
Disclaimer: The article is provided for educational purposes only. It does not represent the opinions of NewsBTC on whether to buy, sell or hold any investments and naturally investing carries risks. You are advised to conduct your own research before making any investment decisions. Use information provided on this website entirely at your own risk.
Source link


Generally, the cryptocurrency market is bearish at the moment, with coins like Avalanche (AVAX), Ethereum, Litecoin, XRP, Solana, and others all caught in this trend. Currently, the price of AVAX is on a strong bearish move below the 100-day Moving Average (MA) and could continue in that direction for a while before retracing.
Technical Indicators Suggest A Bearish Trend For Avalanche
Observing the chart from the 4-hour timeframe, AVAX has crossed below both the 100-day moving average and the trend line. This could mean that the price is on a downward trend. The MACD indicator on the 4-hour timeframe suggests a very strong bearish movement as the MACD histograms are trending below the MACD zero line.
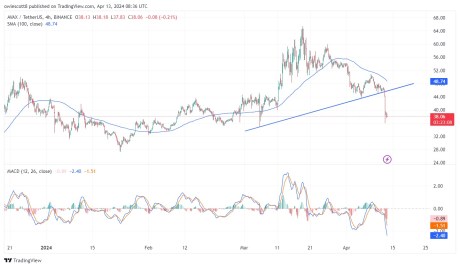
Also, both the MACD line and MACD signal line are trending below the zero line. Given the formation of the MACD indicator, it shows that there is a possibility that the price will still move further downward.
Furthermore, the Relative Strength Index (RSI) also on the 4-hour timeframe suggests a bearish trend as the RSI signal line is trending around the oversold zone. Despite the potential of a retracement at this point, the price will drop more following this.
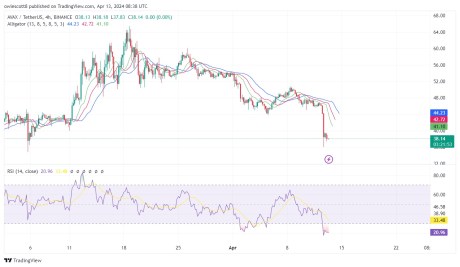
The alligator indicator is another powerful tool used to determine the trend of an asset. A look at the above image shows that both the alligator’s lip and teeth have crossed over the alligator’s jaw facing the downward direction. This formation suggests that the trend is bearish and that the price could witness a deeper decline.
What Could Happen Next
Based on the price’s previous movement, there are two major resistance levels of $50 and $59.99 and a support level of $39.95. As Avalanche is on a negative trajectory, if prices manage to break below the support level of $39.95, it could trigger a move further toward the next low of $27.53.
On the other hand, if the price fails to break below its previous low, it might start an upward correction movement toward the resistance level of $50.80. However, if it manages to break past this level, AVAX might move even further toward the $59.99 resistance level.
As of the time of writing, the Avalanche was trading around $38, indicating a decline of 1.75% in the last 24 hours. Its market cap is down by over 16%, while its trading volume has increased significantly by nearly 250% in the past day.
Featured image from Shutterstock, chart from Tradingview
Disclaimer: The article is provided for educational purposes only. It does not represent the opinions of NewsBTC on whether to buy, sell or hold any investments and naturally investing carries risks. You are advised to conduct your own research before making any investment decisions. Use information provided on this website entirely at your own risk.
Source link

The crypto market is experiencing a pullback after Bitcoin, the leading cryptocurrency, reached a new all-time high. However, Ethereum (ETH) is not left out in this downward move.
After setting a new yearly high of $4,094, the price of Ethereum has been moving downward and this has led to the price trading below the 100-day Moving Average (MA) both in the 1-hour and 4-hour timeframes, but this is not so in the daily timeframe.
Will the price continue downward or will it change direction and start moving upward? At the time of writing, Ethereum’s price was trading around $3,360 and was up by 0.64% in the last 24 hours.
Ethereum Indicators And What They Suggest
Looking at the chart, technically we can see that a support level of $3,067 and a resistance level of $3,681 and $3,591 have been formed respectively. Nonetheless, there could be more support and resistance created if the price continues to move downward.
4-Hour Moving Average: A technical observation of the chart from the 4-hour timeframe as seen in the image below reveals that the price is trending below the 100-day moving average. This suggests that the price is on a downtrend and could potentially move further downward.
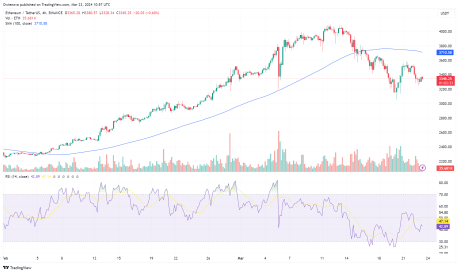
4-Hour RSI indicator: With the help of the Relative Strength Index indicator (RSI) we can see the RSI signal line is trending below the 50 line. This is a strong indication that the price of Ethereum is in a downward trend as observed in the image above.
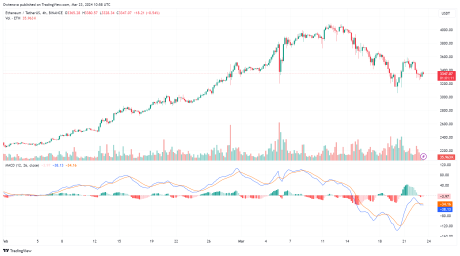
MACD Indicator: Taking a close look at the MACD indicator in the 4-hour timeframe, it appears that the MACD histogram has dropped below the zero line. In addition, both the MACD line and the signal line have crossed below the zero line.
This setup indicates that the price is still bearish and there are possibilities that it could still move downward. The image below provides more details:
Possible Outcome
If the price of Ethereum continues downward and breaks below the support level of $3,067, it could move further downward to create a new support level. However, if the price fails to break below this support level, we could see a price reversal and may start a fresh trend upward. Thus there could be a possibility that the price could break above the resistance levels of $3,681 and $3,591 respectively, and continue its bullish run.
Featured image from iStock, chart from Tradingview.com
Disclaimer: The article is provided for educational purposes only. It does not represent the opinions of NewsBTC on whether to buy, sell or hold any investments and naturally investing carries risks. You are advised to conduct your own research before making any investment decisions. Use information provided on this website entirely at your own risk.
Source link

Insight Into The Timing And Factors

Bitcoin About To ‘Blow Higher’ Despite This Week’s Pullback, According to Glassnode Co-Founders – Here’s Why

Azuro and Chiliz Working Together to Boost Adoption of Onchain Sport Prediction Markets – Blockchain News, Opinion, TV and Jobs

Robinhood Bleeds 164 Million Dogecoin

AIGOLD Goes Live, Introducing the First Gold Backed Crypto Project – Blockchain News, Opinion, TV and Jobs

Analyst Benjamin Cowen Warns Ethereum ‘Still Facing Headwinds,’ Says ETH Will Only Go Up if Bitcoin Does This

Tron Price Prediction: TRX Outperforms Bitcoin, Can It Hit $0.132?

Ethereum-Based Altcoin Leads Real-World Assets Sector in Development Activity, According to Santiment

Here’s Why This Analyst Is Predicting A Rise To $360

Hackers With $182,000,000 Stolen From Poloniex Starts Moving Funds to Tornado Cash

Cardano Faces Make-Or-Break Price Level For Bullish Revival

A Premier Crypto Exchange Tailored for Seasoned Traders – Blockchain News, Opinion, TV and Jobs

Crypto Whale Withdraws $75.8 Million in USDC From Coinbase To Invest In Ethereum’s Biggest Presale – Blockchain News, Opinion, TV and Jobs

CFTC Chair Says ‘Another Cycle of Enforcement Actions’ Coming As Crypto Enters New Phase of Asset Appreciation

Spectral Labs Joins Hugging Face’s ESP Program to advance the Onchain x Open-Source AI Community – Blockchain News, Opinion, TV and Jobs

Bitcoin Dropped Below 2017 All-Time-High but Could Sellers be Getting Exhausted? – Blockchain News, Opinion, TV and Jobs

What does the Coinbase Premium Gap Tell us about Investor Activity? – Blockchain News, Opinion, TV and Jobs
BNM DAO Token Airdrop

NFT Sector Keeps Developing – Number of Unique Ethereum NFT Traders Surged 276% in 2022 – Blockchain News, Opinion, TV and Jobs
New Minting Services

Block News Media Live Stream
A String of 200 ‘Sleeping Bitcoins’ From 2010 Worth $4.27 Million Moved on Friday

SEC’s Chairman Gensler Takes Aggressive Stance on Tokens – Blockchain News, Opinion, TV and Jobs

Friends or Enemies? – Blockchain News, Opinion, TV and Jobs

Enjoy frictionless crypto purchases with Apple Pay and Google Pay | by Jim | @blockchain | Jun, 2022

Block News Media Live Stream

How Web3 can prevent Hollywood strikes

Block News Media Live Stream

XRP Explodes With 1,300% Surge In Trading Volume As crypto Exchanges Jump On Board
Block News Media Live Stream
 Altcoins2 years ago
Bitcoin Dropped Below 2017 All-Time-High but Could Sellers be Getting Exhausted? – Blockchain News, Opinion, TV and Jobs
 Binance2 years ago
What does the Coinbase Premium Gap Tell us about Investor Activity? – Blockchain News, Opinion, TV and Jobs
- Uncategorized2 years ago
BNM DAO Token Airdrop
 BTC1 year ago
NFT Sector Keeps Developing – Number of Unique Ethereum NFT Traders Surged 276% in 2022 – Blockchain News, Opinion, TV and Jobs
- Uncategorized3 years ago
New Minting Services
 Video2 years ago
Block News Media Live Stream

 Bitcoin miners2 years ago
A String of 200 ‘Sleeping Bitcoins’ From 2010 Worth $4.27 Million Moved on Friday
 Bitcoin1 year ago
SEC’s Chairman Gensler Takes Aggressive Stance on Tokens – Blockchain News, Opinion, TV and Jobs
