
DOT
DOT Price (Polkadot) Reaches Key Juncture, Is This Bulls Trap or Correction?
Polkadot (DOT) is correcting gains from the $7.5 resistance against the US Dollar. The price could start another increase if it stays above the $6.75 support.
- DOT gained pace and tested the $7.5 resistance level against the US Dollar.
- The price is trading above the $7.00 zone and the 100 simple moving average (4 hours).
- There is a short-term expanding triangle forming with resistance at $7.50 on the 4-hour chart of the DOT/USD pair (data source from Kraken).
- The pair could continue to decline if it fails to stay above the $6.75 support.
Polkadot Price Holds Support
After forming a base above the $6.00 level, DOT price started a decent increase. It broke many hurdles near $6.75 and even spiked above $7.25. A high was formed at $7.46 and the price is now correcting gains, like Ethereum and Bitcoin.
There was a move below the $7.25 support zone. The price declined below the 23.6% Fib retracement level of the upward move from the $6.03 swing low to the $7.46 high.
DOT is now trading above the $7.00 zone and the 100 simple moving average (4 hours). Immediate resistance is near the $7.25 level. The next major resistance is near $7.50. There is also a short-term expanding triangle forming with resistance at $7.50 on the 4-hour chart of the DOT/USD pair.
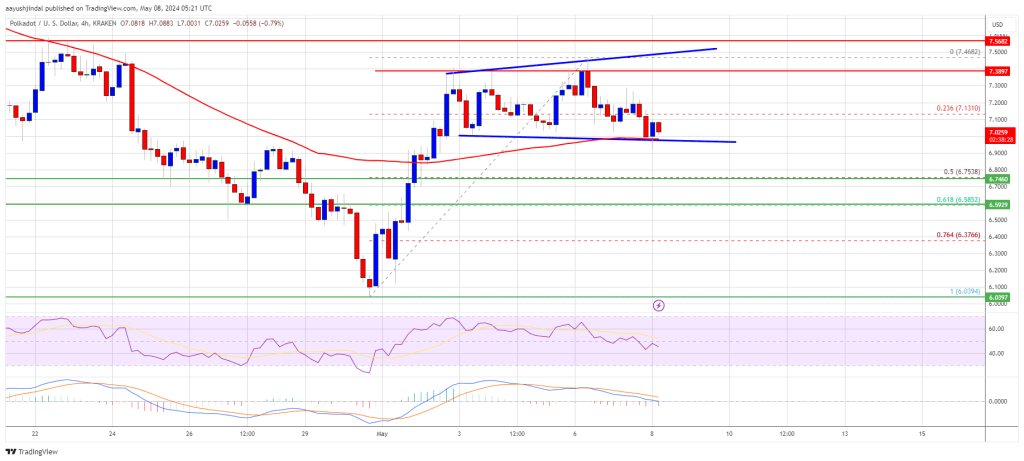
Source: DOTUSD on TradingView.com
A successful break above $7.50 could start another strong rally. In the stated case, the price could easily rally toward $8.00 in the near term. The next major resistance is seen near the $8.80 zone.
More Downsides in DOT?
If DOT price fails to start a fresh increase above $7.25, it could continue to move down. The first key support is near the $7.00 level and the 100 simple moving average (4 hours).
The next major support is near the $6.75 level or the 50% Fib retracement level of the upward move from the $6.03 swing low to the $7.46 high, below which the price might decline to $6.50. Any more losses may perhaps open the doors for a move toward the $6.10 support zone or $6.00.
Technical Indicators
4-Hours MACD – The MACD for DOT/USD is now losing momentum in the bearish zone.
4-Hours RSI (Relative Strength Index) – The RSI for DOT/USD is now below the 50 level.
Major Support Levels – $7.00, $6.75 and $6.50.
Major Resistance Levels – $7.25, $7.50, and $8.00.
Disclaimer: The article is provided for educational purposes only. It does not represent the opinions of NewsBTC on whether to buy, sell or hold any investments and naturally investing carries risks. You are advised to conduct your own research before making any investment decisions. Use information provided on this website entirely at your own risk.
Source link


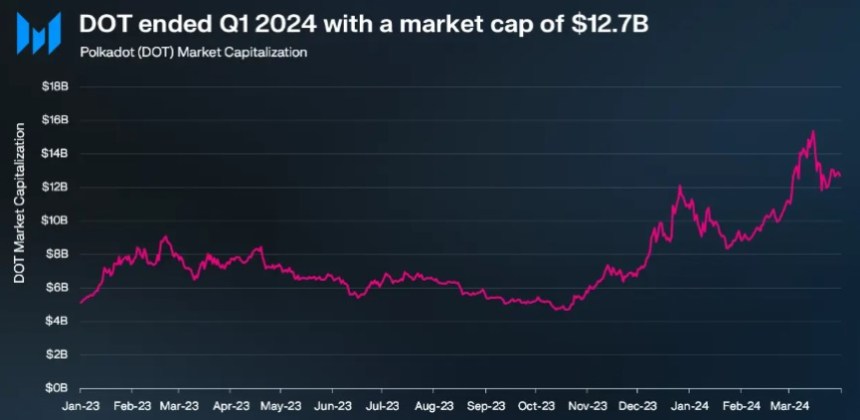
According to a Messari report, the Polkadot (DOT) blockchain protocol made significant progress in the first quarter (Q1) of the year in terms of market capitalization, revenue, and Cross-Consensus Message Format (XCM) activity, as well as a record increase in daily active addresses.
DOT’s Market Cap Surges 16% QoQ
During Q4 2023, Polkadot’s market capitalization experienced a notable 111% quarter-on-quarter (QoQ) increase, reaching $8.4 billion. Building on this momentum, Q1 2024 witnessed a further 16% QoQ rise, elevating the circulating market cap to $12.7 billion.
Despite these gains, DOT’s market capitalization remains 80% below its all-time high of $55.5 billion, set on November 8, 2021.
In Q4 2023, Polkadot’s revenue also skyrocketed by 2,880% QoQ, amounting to $2.8 million. Per the report, this surge was primarily attributed to an exponential increase in extrinsics, driven by the Polkadot Inscriptions.
However, revenue metrics for Q1 2024 declined significantly on a QoQ basis, with revenue in USD dropping by 91% to $241,000 and revenue in DOT decreasing by 92% to 28,800. It is worth noting that Polkadot’s revenue tends to be relatively lower compared to its competitors due to the network’s structural design.
Polkadot’s XCM activity continued to show growth in Q1 2024. Daily XCM transfers surged by 89% QoQ to reach 2,700, while non-asset transfer use cases, known as “XCM other,” witnessed a 214% QoQ increase, averaging 185 daily transfers.
The total number of daily XCM messages grew 94% QoQ to 2,800, demonstrating the network’s dynamic ecosystem. In addition, the number of active XCM channels grew 13% QoQ to a total of 230.
Polkadot’s Parachain Network Soars To New Heights
Q1 2024 marked a significant kick-off to the year for Polkadot’s parachains, with active addresses reaching an all-time high of 514,000, representing a substantial 48% QoQ growth.
Moonbeam emerged as the leading parachain with 217,000 monthly active addresses, a solid 110% QoQ increase. Nodle followed closely with 54,000 monthly active addresses, doubling from the previous quarter.
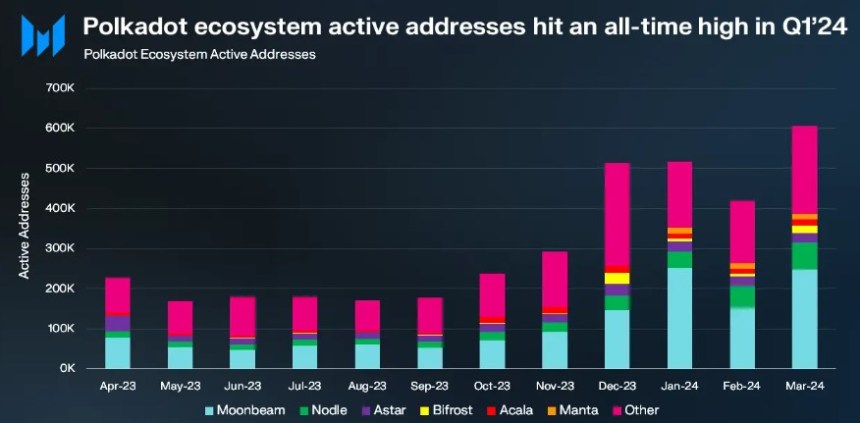
Astar on the other hand, experienced a modest 8% QoQ growth to reach 26,000 active addresses, while Bifrost Finance grew slightly by 2% QoQ to 10,000 addresses. However, Acala experienced a decline, with monthly active addresses falling to 13,000, down 16% QoQ.
Notably, the Manta Network stood out among parachains in Q1 2024, with a significant surge in daily active addresses, reaching 15,000. According to Messari, this increase was fueled by the successful launch of the MANTA token TGE and subsequent listing on Binance, propelling Manta’s Total Value Locked (TVL) to over $440 million.
Polkadot Price Sees Upside Potential Ahead
In terms of price action, Polkadot’s native token DOT has regained bullish momentum following a sharp drop to the $5.8 price mark after reaching a yearly high of $11 on March 14.
Currently, DOT has regained the $7.25 level, up 7% over the past week. However, DOT’s trading volume decreased slightly by 4.7% compared to the previous trading session, amounting to $320 million over the past 24 hours, according to CoinGecko data.
If the bullish momentum persists, Polkadot faces its first resistance at the $7.4 zone, which serves as the last threshold before a potential retest of the $8 resistance wall.
On the other hand, the $6.4 support floor has proven to be successful after being tested for two consecutive days this week, highlighting its significance as a key level to watch for the token’s upward movement prospects.
Featured image from Shuttestock, chart from TradingView.com
Disclaimer: The article is provided for educational purposes only. It does not represent the opinions of NewsBTC on whether to buy, sell or hold any investments and naturally investing carries risks. You are advised to conduct your own research before making any investment decisions. Use information provided on this website entirely at your own risk.
Source link
Polkadot (DOT) is showing bearish signs below the $8 resistance against the US Dollar. The price could extend its decline if it fails to stay above $6.00.
- DOT is gaining pace below the $8.80 and $8.00 levels against the US Dollar.
- The price is trading below the $7.20 zone and the 100 simple moving average (4 hours).
- There is a key bearish trend line forming with resistance at $6.50 on the 4-hour chart of the DOT/USD pair (data source from Kraken).
- The pair could continue to decline toward the $5.00 support zone.
Polkadot Price Resumes Drop
After a steady increase, DOT price faced resistance near the $7.60 zone. It formed a short-term top and started a fresh decline below the $7.00 level, like Ethereum and Bitcoin.
There was a move below the $6.20 support zone. A low was formed near $6.03 and the price is now consolidating losses. It is slowly moving higher above the $6.35 level and the 23.6% Fib retracement level of the downward move from the $7.58 swing high to the $6.03 low.
DOT is now trading below the $7.00 zone and the 100 simple moving average (4 hours). Immediate resistance is near the $6.50 level. There is also a key bearish trend line forming with resistance at $6.50 on the 4-hour chart of the DOT/USD pair.
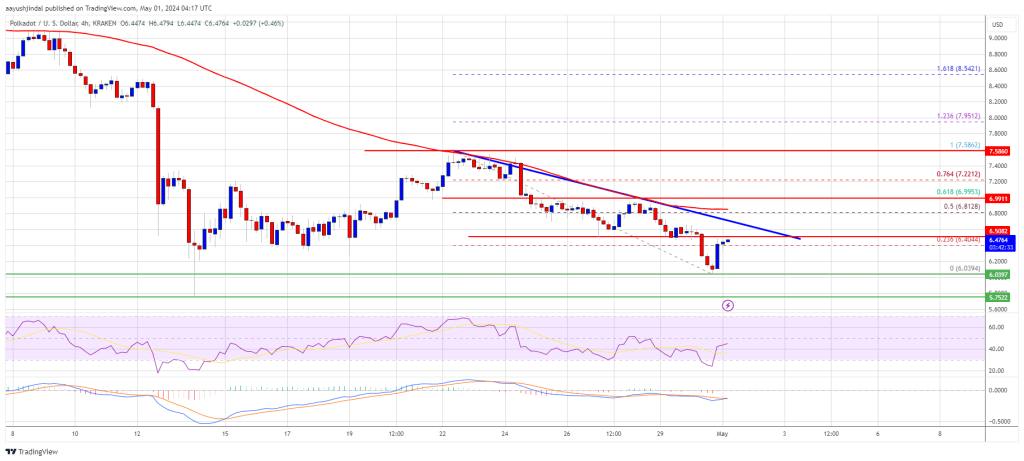
Source: DOTUSD on TradingView.com
The next major resistance is near $7.00 or the 61.8% Fib retracement level of the downward move from the $7.58 swing high to the $6.03 low. A successful break above $7.00 could start another strong rally. In the stated case, the price could easily rally toward $8.20 in the near term. The next major resistance is seen near the $10.00 zone.
More Downsides in DOT?
If DOT price fails to start a fresh increase above $7.00, it could continue to move down. The first key support is near the $6.00 level.
The next major support is near the $5.65 level, below which the price might decline to $5.00. Any more losses may perhaps open the doors for a move toward the $4.20 support zone or the trend line.
Technical Indicators
4-Hours MACD – The MACD for DOT/USD is now losing momentum in the bearish zone.
4-Hours RSI (Relative Strength Index) – The RSI for DOT/USD is now below the 50 level.
Major Support Levels – $6.00, $5.65 and $5.00.
Major Resistance Levels – $6.50, $7.00, and $8.50.
Source link
Polkadot, a blockchain platform designed for interoperability between different blockchains, is experiencing a surge in new users, but a disconnect between user growth and network activity is raising questions about its long-term viability.
Based on the latest figures, DOT tallied an all-time high in active wallets and unique accounts in March, surpassing 600,000 and 5.59 million, respectively. This suggests a growing interest in the platform, potentially driven by the thriving developer ecosystem on Polkadot’s parachains, specialized blockchains that connect to the main Polkadot chain. Moonbeam, a prominent parachain, played a particularly significant role, contributing the highest number of active addresses with nearly 250,000.
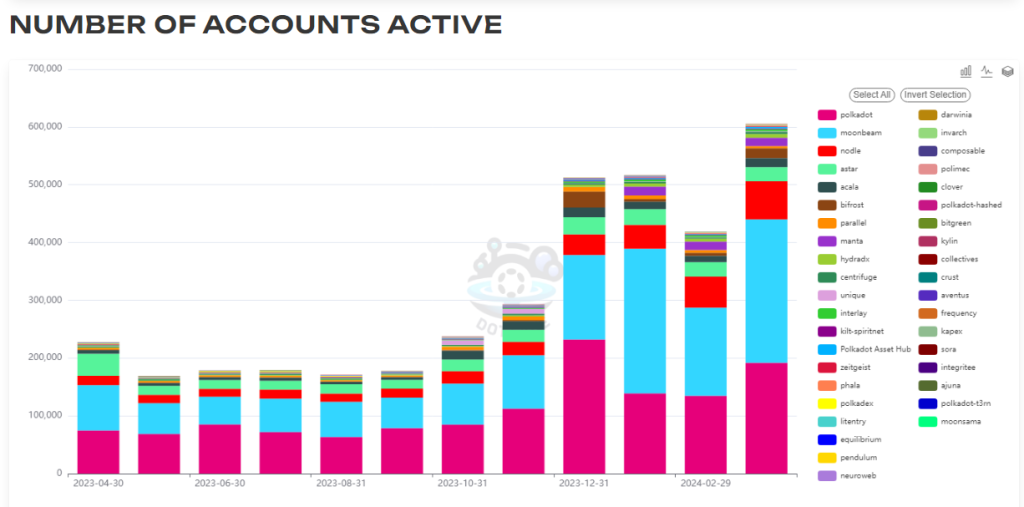
Source: Data
Polkadot Transactions Dip Despite Active User Growth
However, despite the influx of new users, the number of transactions on the Polkadot network hasn’t kept pace. While there was a modest increase in transactions compared to February, the current volume remains significantly lower than the peak recorded in December.
This inconsistency raises concerns about how actively users are engaging with the network. The possibility exists that users are holding or staking their DOT tokens instead of utilizing them for transactions on the platform.
Total crypto market cap is currently at $2.5 trillion. Chart: TradingView
Polkadot Price Seeks Stability After Recent Decline
The price of Polkadot’s native token, DOT, seems to be finding support around $9. This could indicate a period of consolidation after a decline from its previous highs above $11. While a price increase is typically seen as a positive sign, it’s important to consider it alongside actual network usage.
Source: Data
Is Polkadot Building Without Using?
The current situation with Polkadot presents a paradox. The platform is attracting new users, but they aren’t necessarily translating into active network participants. This could be due to several factors. Perhaps users are waiting for a specific application or service to be built on Polkadot before actively engaging. It’s also possible that technical limitations are hindering user activity.
Further analysis is needed to understand the reasons behind the lagging transactions. Examining the types of transactions occurring on the network could provide valuable insights. For instance, an increase in governance-related transactions might suggest a more engaged user base, even if overall transaction volume remains low.
Polkadot’s Future Hinges On Active Network Use
While the growth in active wallets and accounts is a positive sign for Polkadot, it’s crucial to convert this interest into actual network usage. The success of Moonbeam demonstrates the potential for a vibrant developer ecosystem on Polkadot. However, broader adoption across various use cases is necessary for the platform to reach its full potential.
Featured image from Pexels, chart from TradingView
Disclaimer: The article is provided for educational purposes only. It does not represent the opinions of NewsBTC on whether to buy, sell or hold any investments and naturally investing carries risks. You are advised to conduct your own research before making any investment decisions. Use information provided on this website entirely at your own risk.
Source link

Insight Into The Timing And Factors

Bitcoin About To ‘Blow Higher’ Despite This Week’s Pullback, According to Glassnode Co-Founders – Here’s Why

Azuro and Chiliz Working Together to Boost Adoption of Onchain Sport Prediction Markets – Blockchain News, Opinion, TV and Jobs

Robinhood Bleeds 164 Million Dogecoin

AIGOLD Goes Live, Introducing the First Gold Backed Crypto Project – Blockchain News, Opinion, TV and Jobs

Analyst Benjamin Cowen Warns Ethereum ‘Still Facing Headwinds,’ Says ETH Will Only Go Up if Bitcoin Does This

Tron Price Prediction: TRX Outperforms Bitcoin, Can It Hit $0.132?

Ethereum-Based Altcoin Leads Real-World Assets Sector in Development Activity, According to Santiment

Here’s Why This Analyst Is Predicting A Rise To $360

Hackers With $182,000,000 Stolen From Poloniex Starts Moving Funds to Tornado Cash

Cardano Faces Make-Or-Break Price Level For Bullish Revival

A Premier Crypto Exchange Tailored for Seasoned Traders – Blockchain News, Opinion, TV and Jobs

Crypto Whale Withdraws $75.8 Million in USDC From Coinbase To Invest In Ethereum’s Biggest Presale – Blockchain News, Opinion, TV and Jobs

CFTC Chair Says ‘Another Cycle of Enforcement Actions’ Coming As Crypto Enters New Phase of Asset Appreciation

Spectral Labs Joins Hugging Face’s ESP Program to advance the Onchain x Open-Source AI Community – Blockchain News, Opinion, TV and Jobs

Bitcoin Dropped Below 2017 All-Time-High but Could Sellers be Getting Exhausted? – Blockchain News, Opinion, TV and Jobs

What does the Coinbase Premium Gap Tell us about Investor Activity? – Blockchain News, Opinion, TV and Jobs
BNM DAO Token Airdrop

NFT Sector Keeps Developing - Number of Unique Ethereum NFT Traders Surged 276% in 2022 – Blockchain News, Opinion, TV and Jobs
New Minting Services

Block News Media Live Stream
A String of 200 ‘Sleeping Bitcoins’ From 2010 Worth $4.27 Million Moved on Friday

SEC’s Chairman Gensler Takes Aggressive Stance on Tokens – Blockchain News, Opinion, TV and Jobs

Friends or Enemies? – Blockchain News, Opinion, TV and Jobs

Enjoy frictionless crypto purchases with Apple Pay and Google Pay | by Jim | @blockchain | Jun, 2022

Block News Media Live Stream

How Web3 can prevent Hollywood strikes

Block News Media Live Stream

XRP Explodes With 1,300% Surge In Trading Volume As crypto Exchanges Jump On Board
Block News Media Live Stream
 Altcoins2 years ago
Bitcoin Dropped Below 2017 All-Time-High but Could Sellers be Getting Exhausted? – Blockchain News, Opinion, TV and Jobs
 Binance2 years ago
What does the Coinbase Premium Gap Tell us about Investor Activity? – Blockchain News, Opinion, TV and Jobs
- Uncategorized2 years ago
BNM DAO Token Airdrop
 BTC1 year ago
NFT Sector Keeps Developing - Number of Unique Ethereum NFT Traders Surged 276% in 2022 – Blockchain News, Opinion, TV and Jobs
- Uncategorized3 years ago
New Minting Services
 Video2 years ago
Block News Media Live Stream

 Bitcoin miners2 years ago
A String of 200 ‘Sleeping Bitcoins’ From 2010 Worth $4.27 Million Moved on Friday
 Bitcoin1 year ago
SEC’s Chairman Gensler Takes Aggressive Stance on Tokens – Blockchain News, Opinion, TV and Jobs
