
Aave
Aave proposal to freeze alleged Curve founder’s loans draws controversy

A June 12 AAVE (AAVE) proposal aimed at preventing a particular account from accumulating more debt has led to controversy, with some participants arguing that the proposal violates the principle of censorship-resistance or “neutrality” in decentralized finance, or DeFi.
Some participants believe that the account is owned by Curve (CRV) founder Michael Egorov. Cointelegraph was not able to independently confirm who the account’s owner is.
Uhh seems like Curve’s founder has a $110m leverage position against his $CRV stack across all Defi.
If not repaid at some point (spoil: it prob won’t, my man is taking profit), this will cascade into a lot of bad debt for lending protocols https://t.co/kxwc0Sk65V pic.twitter.com/yhHp9JFWBV
— vapor (@trading_vapor) June 14, 2023
According to the proposal’s author, financial modeling platform Gauntlet, the Ethereum address 0x7a16ff8270133f063aab6c9977183d9e72835428 has accumulated $67.7 million worth of debt in US Dollar Coin (USDC) and Tether (USDT) through the AAVE V2 protocol using $185 million of Curve tokens as collateral.
Gauntlet expressed fears that this account may continue increasing its debt, leading to the risk that it may be liquidated if there is a sudden fall in the price of Curve. Compounding the problem in Gauntlet’s view is the fact that CRV has suffered a decline in liquidity over the past few months. This may cause slippage if the account gets liquidated, as there may not be enough buyers of CRV in the marketplace willing to take on such a large amount of tokens.
This may lead to millions of dollars in bad debt for AAVE, Gauntlet suggested.
AAVE user DecentMuse claimed that the wallet address “is tagged as belonging to the founder of Curve,” indicating that it may belong to Egorov. In DecentMuse’s view, the loan may represent a way for the founder to take profits from his entrepreneurial activities on behalf of Curve. Cointelegraph was not able to confirm the identity of the address’s owner.
In the proposal, Gauntlet suggested that the AAVE decentralized autonomous organization (AAVE DAO) should implement a patch to freeze any further uses of CRV as collateral for loans. This would allow the account to continue holding its current loan position, but would also prevent it from accumulating any further debt.
Related: Bug in Aave v2 on Polygon causes some assets to become stuck in contracts
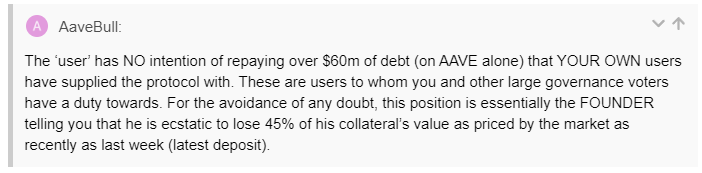
Some forum participants supported the proposal and criticized the account for piling on so much debt. For example, a user who goes by the handle “AAVEBull” reportedly claimed that the account must have no intention of paying off its debts, since it has continuously added to its position as the token has declined in price.
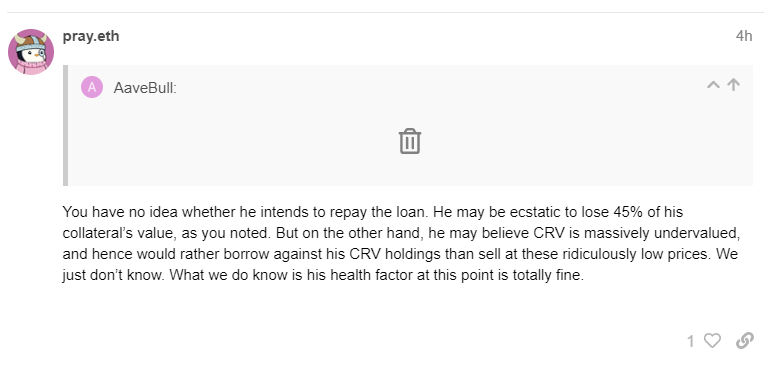
In response, critics of the proposal defended the account. For example, user pray.eth stated that the account’s owner may simply believe CRV tokens are radically undervalued; leading them to believe that as the price declines, it makes sense to increase their use as collateral.
Aave-Chan Initiative (ACI) founder Marc Zeller, who is a frequent participant in the forums, also weighed in on the proposal. He stated that AAVE DAO should be careful not to violate “the core ethos of DeFi, which is neutrality.” “The intention of users or what they do with their funds is not our primary concern,” Zeller stated, adding “Users should be free to utilize the protocol as they see fit.”
The proposal is listed as a “recommendation” as of June 16. This means that it has not yet been turned into a formal AAVE Improvement Proposal (AIP) that can be voted on by the DAO. The author has stated that turning it into a formal AIP is the proposal’s “next step.”
Participants in the blockchain ecosystem continue to debate the limits of censorship-resistance. In January, many Bitcoin users complained of high fees caused by other users minting and trading Ordinals. Some users wanted to ban ordinals, while others saw a ban as censorship.
On April 11, Tether blacklisted an address that had drained $25 million from EVM front-running bots. Polygon co-founder Jaynti Kanani said the blacklisting established “a bad precedent” that could lead to more transactions being censored, while on-chain sleuth ZachXBT claimed that Tether may have been forced to engage in the act due to a court order.
Magazine: Hyperbitcoinization is underway, RFK seeks Bitcoin donations and other news
Source link


Following TrustToken’s decision to temporarily halt mints and redemptions of its TrueUSD (TUSD) stablecoin through its banking partner, Prime Trust, a trader has taken advantage of the situation by initiating an on-chain short position.
According to on-chain data, an Ethereum user utilized Aave’s v2 lending platform to deposit 7.5 million USD Coin (USDC) as collateral. They then borrowed 4 million TUSD and promptly sold it for USDC. This strategy of borrowing and immediately selling is frequently employed to establish a short position on a particular asset.
Earlier this month, the TrueUSD team announced the suspension of new TUSD minting through its custodial partner, Prime Trust, a company based in Las Vegas, Nevada. Subsequently, the Financial Institutions Division of the Nevada Department of Business and Industry issued a cease-and-desist order against Prime Trust.
In response to the Prime Trust situation, the TrueUSD issuer clarified that it does not affect its operations concerning the conversion of fiat to stablecoin and vice versa. Through a statement, the issuer affirmed that it has no exposure to Prime Trust and maintains multiple United States dollar rails for the minting and redemption of TrueUSD, as stated in a tweet.
The wallet infrastructure provider and digital asset custodian BitGo previously signed a non-binding letter of intent to acquire Prime Trust, according to an announcement on June 8. However, On June 22, BitGo announced on Twitter that it had decided to cancel its acquisition of Prime Trust.
Related: Circle and Sequoia were among top depositors at Silicon Valley Bank: Report
Following legal action by the New York Department of Financial Services and the U.S. Securities and Exchange Commission against the Binance-branded Binance USD (BUSD) stablecoin and its issuer, Paxos Trust, Binance replaced its BUSD holdings with TUSD, which led to a significant increase in its usage and popularity.
TUSD is the fifth-largest stablecoin after Tether (USDT), USDC, Dai (DAI) and BUSD, with a market capitalization of just over $3.1 billion, according to CoinGecko.
Magazine: Yuan stablecoin team arrested
Source link

After experiencing a promising start to the year, AAVE faced a setback when it encountered resistance at the $92 level, resulting in a 34% correction over a two-month period. The recent blow to the crypto market caused by the SEC suing Binance has further impacted the altcoin’s performance.
In the past 24 hours, AAVE has lost 3% of its value, and on the weekly chart, the coin has seen a significant plunge of nearly 12%. Technical indicators suggest the presence of considerable bearish pressure, with both demand and accumulation declining.
With Bitcoin also experiencing a drop to the $25,000 zone, most altcoins have exhibited similar price actions. AAVE has struggled to maintain its price above a crucial support level, and as selling pressure has intensified, it has dipped below that level. The market capitalization of AAVE has also depreciated, indicating that sellers currently hold control over the price at this time.
Aave Price Analysis: One-Day Chart
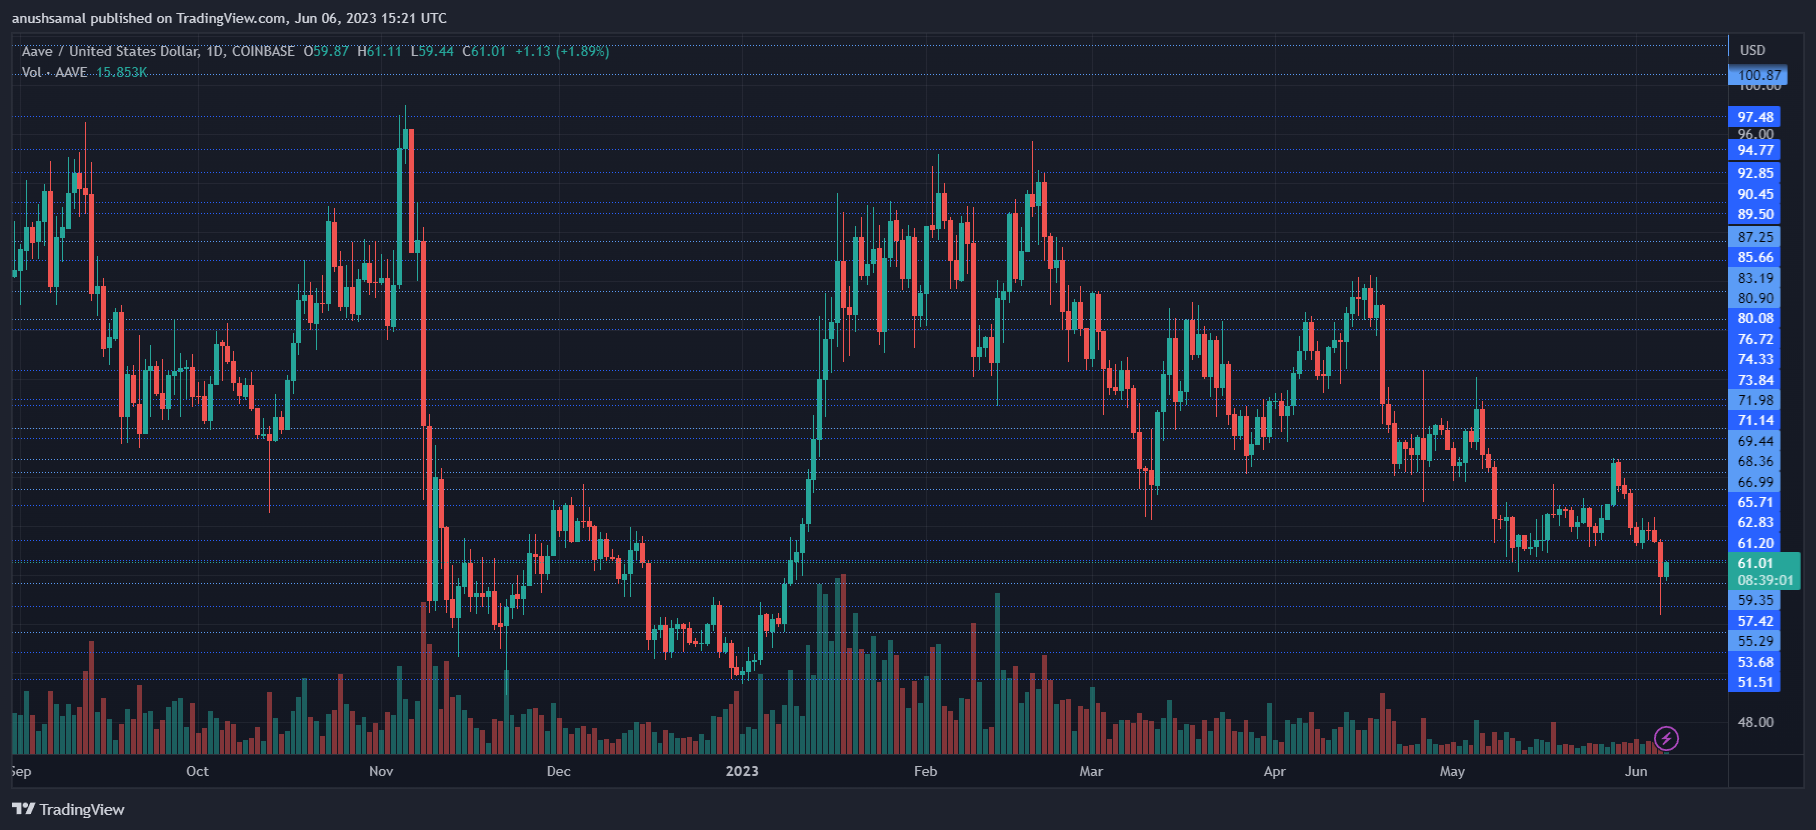
As of the time of writing, Aave is trading at $61. The bulls encountered resistance at the $62 level as the broader market showed signs of weakness in recent days. The altcoin’s resistance levels are at $61.30 and $62.80.
If the price breaks above $62.80, it could potentially reach the $65 price level. However, the bears have exerted influence, which may cause Aave to approach its support line at $59.
If unable to stay above this support, the coin could drop to $57 and potentially even $51, serving as short-selling targets for traders. The trading volume for Aave in the last session has remained low, indicating a lack of strong buying pressure.
Technical Analysis
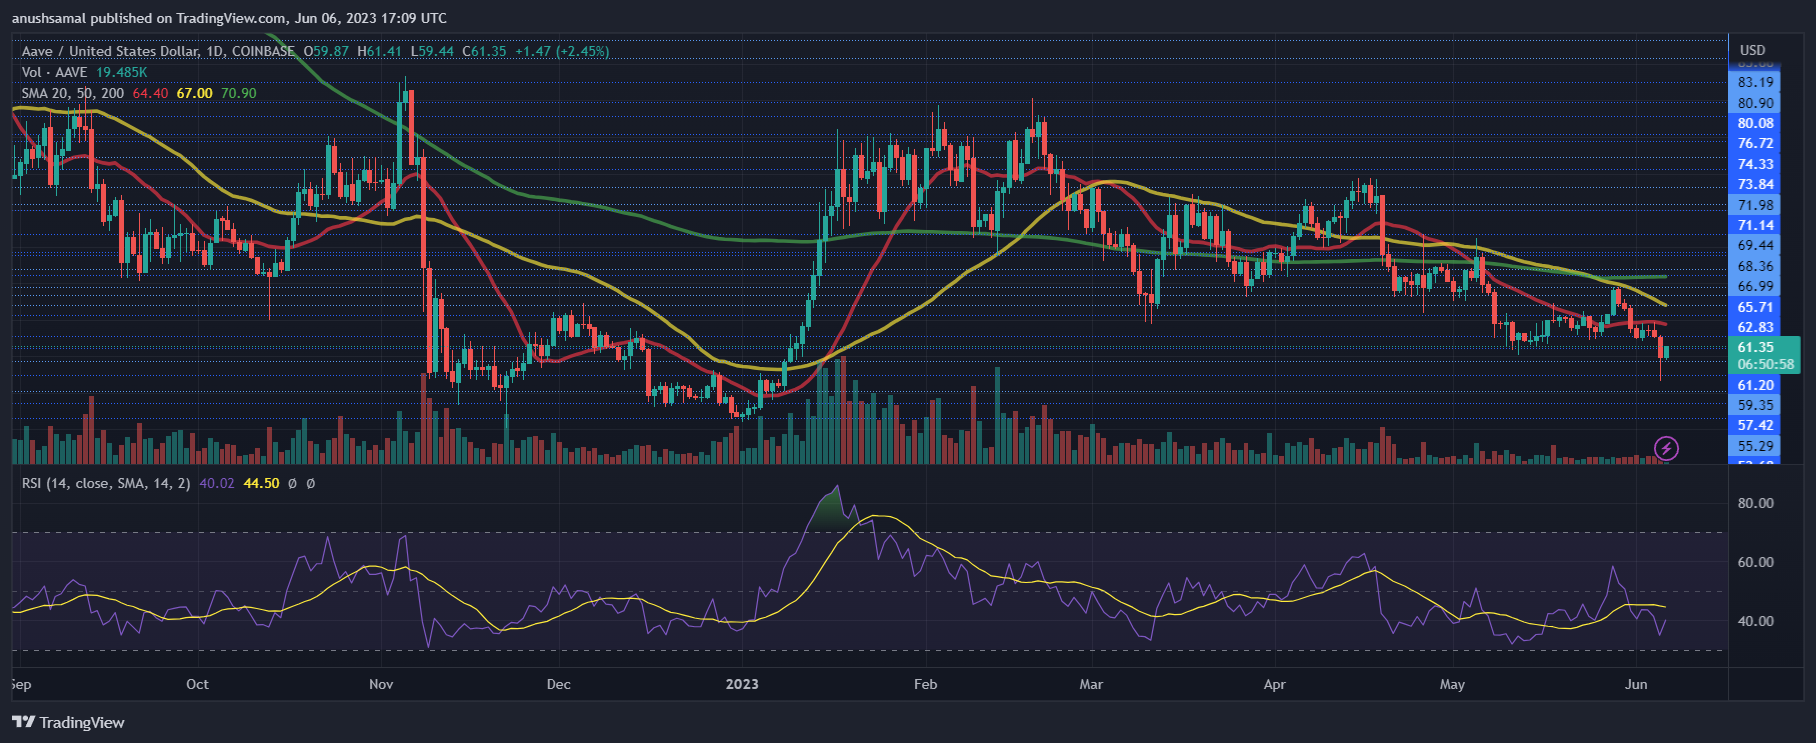
Aave has been facing challenges in generating demand, as reflected in its chart. The Relative Strength Index (RSI) indicates that sellers have outnumbered buyers in the market, with the RSI remaining below the half-line.
In order for buying strength to persist, the price needs to surpass overhead resistance levels. Additionally, Aave has dropped below the 20-Simple Moving Average line, suggesting that sellers have been driving the price momentum in the market. These factors indicate the prevailing bearish sentiment surrounding Aave’s performance.
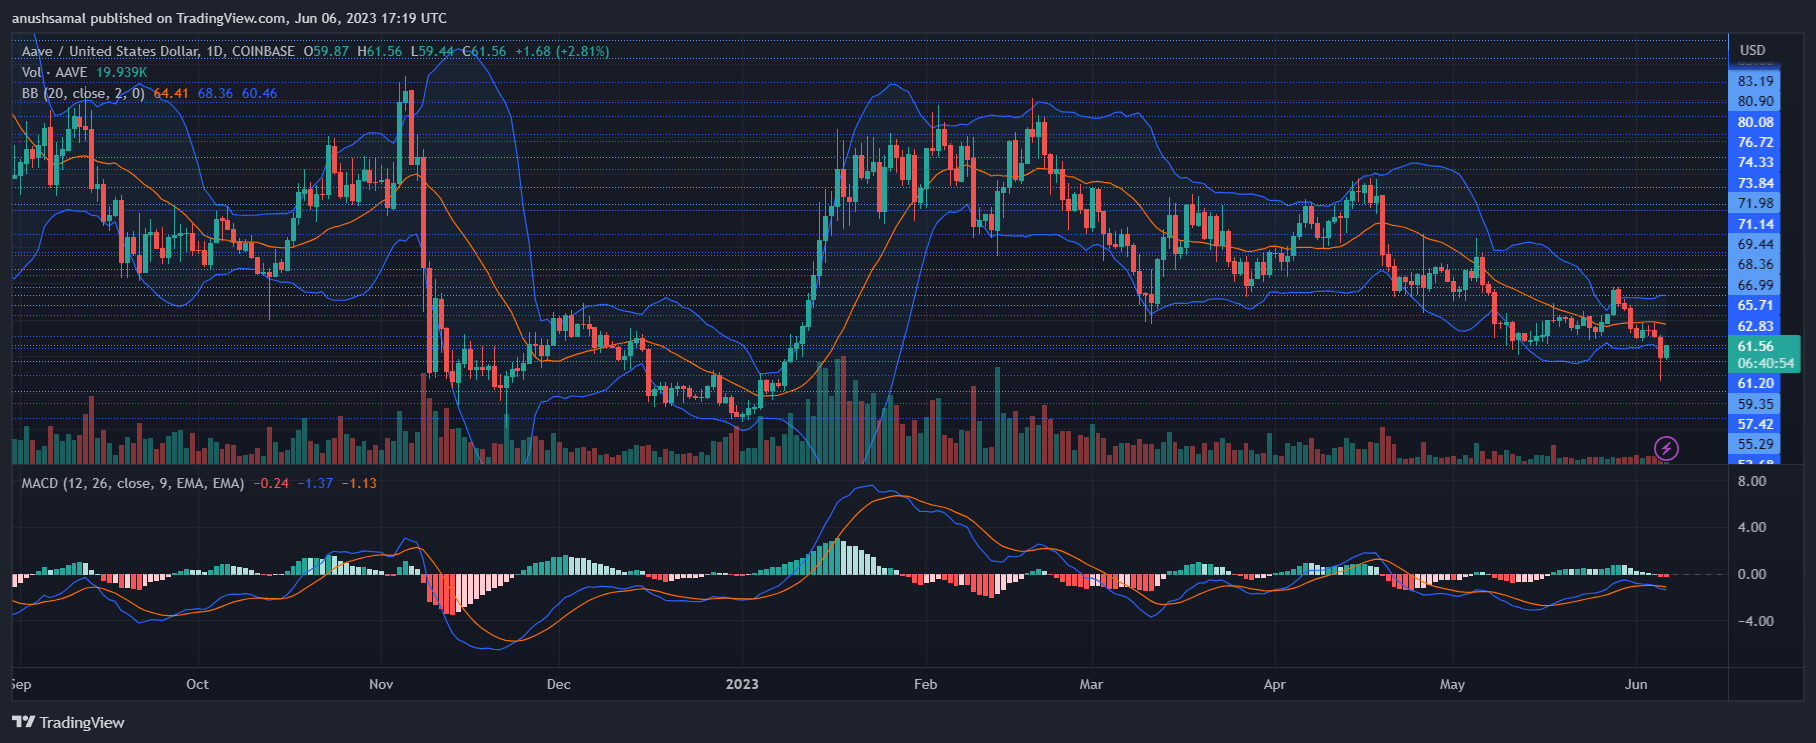
Confirming the bearish sentiment on the chart, Aave has generated sell signals on the one-day chart, aligning with other indicators. The Moving Average Convergence Divergence (MACD), which illustrates price momentum and potential reversals, has formed red histograms, indicating sell signals for the altcoin.
The Bollinger Bands, which measure price volatility and fluctuations, have mostly remained parallel with slight divergence. This suggests that the price of the altcoin may experience slight fluctuations in the upcoming trading sessions.
Featured Image From Figma, Charts From TradingView.com
Source link

The United States looks to avoid a catastrophic debt default after the White House and the House Republicans agreed upon a tentative deal on May 27. The U.S. equities markets rallied in anticipation of the deal on May 26 and the positive sentiment has rubbed off onto the cryptocurrency sector, which is attempting a recovery.
Buying is not limited to Bitcoin (BTC) alone as select altcoins are also showing signs of a short-term up-move. However, sustaining the rally at higher levels may prove to be difficult for the bulls.
After the debt ceiling deal, traders are likely to focus their attention on the Federal Reserve’s rate hikes. The hot Personal Consumption Expenditures data on May 26 increased the likelihood of a rate hike at the Fed’s June meeting. The probability of a 25 basis point rate hike has risen from 17% a week back to 64% on May 28, according to the CME FedWatch Tool.
Along with Bitcoin, what altcoins that are looking ripe for a short-term up-move? Let’s study the charts of these top five cryptocurrencies to spot the important levels to watch out for.
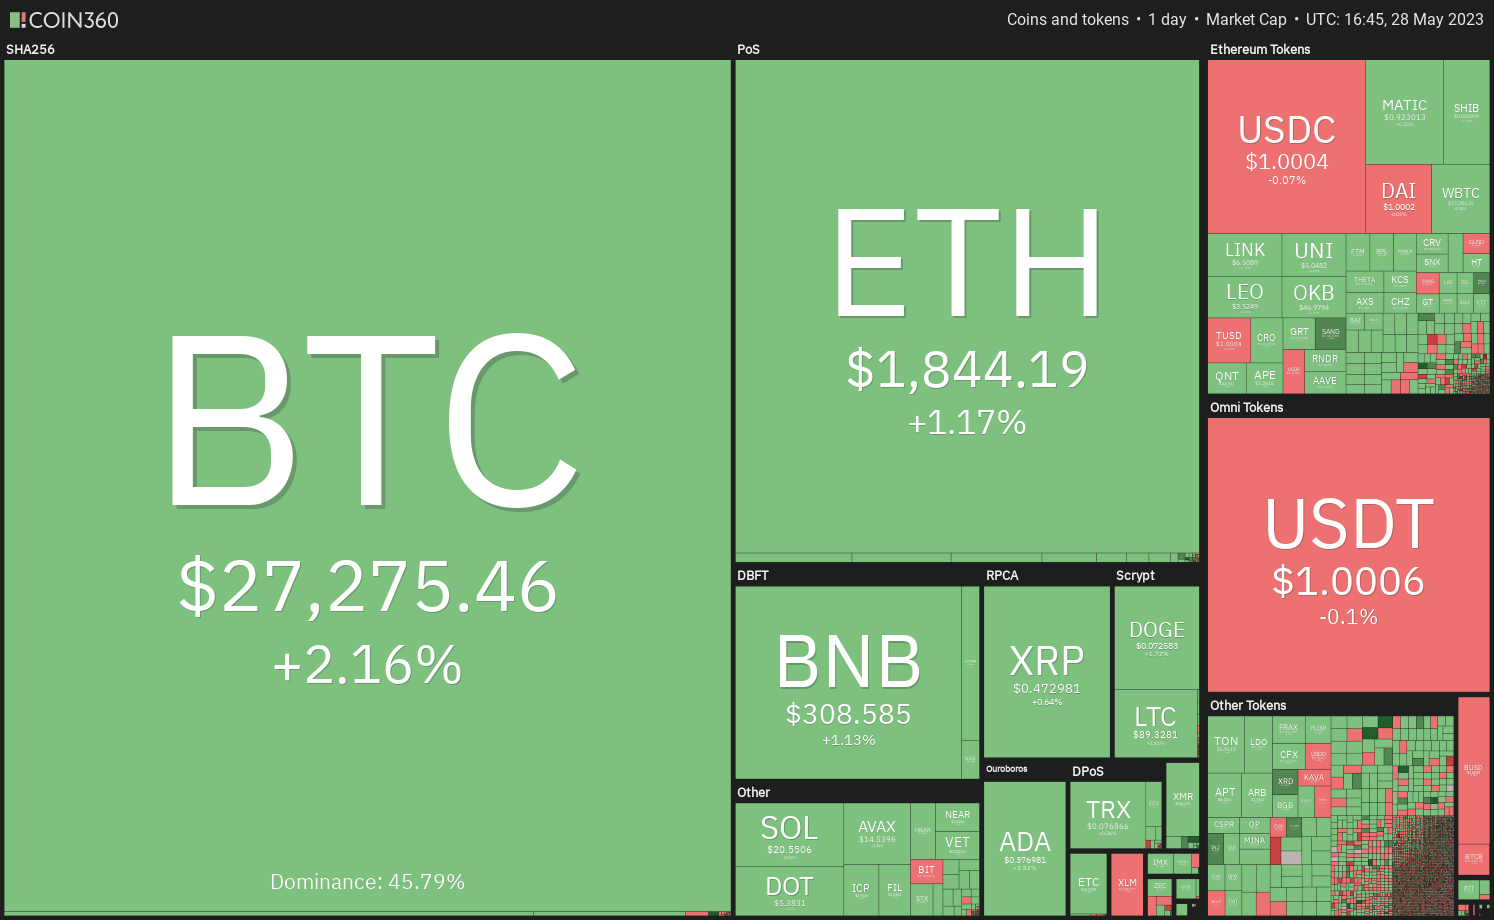
Bitcoin price analysis
Bitcoin has reached the overhead resistance zone between the 20-day exponential moving average ($27,146) and the support line of the symmetrical triangle. This zone is likely to witness a solid tussle between the bulls and the bears.
If the price turns down from the overhead zone, the bears will make another attempt to yank the price to the pivotal support at $25,250. The bulls are expected to defend the zone between $25,250 and $24,000 with all their might because a break below it could intensify selling. The BTC/USDT pair could then tumble to $20,000.
On the contrary, if buyers overcome the overhead obstacle and push the price back into the triangle, it will suggest strong buying on dips. That increases the possibility of a break above the resistance line of the triangle. The pair may then soar to $31,000.
The 4-hour chart shows that the pair is trading inside a descending channel pattern and the bears are trying to defend the resistance line. If the price turns down from the current level but rebounds off the 20-EMA, it will indicate that dips are being bought.
The bulls will then again try to thrust the price above the channel. If they succeed, the pair may start an up-move to $28,400.
Contrarily, a break below the moving averages will suggest that the pair may extend its stay inside the channel for some more time.
XRP price analysis
XRP (XRP) has formed an inverse head and shoulders pattern, which will complete on a break and close above the neckline.
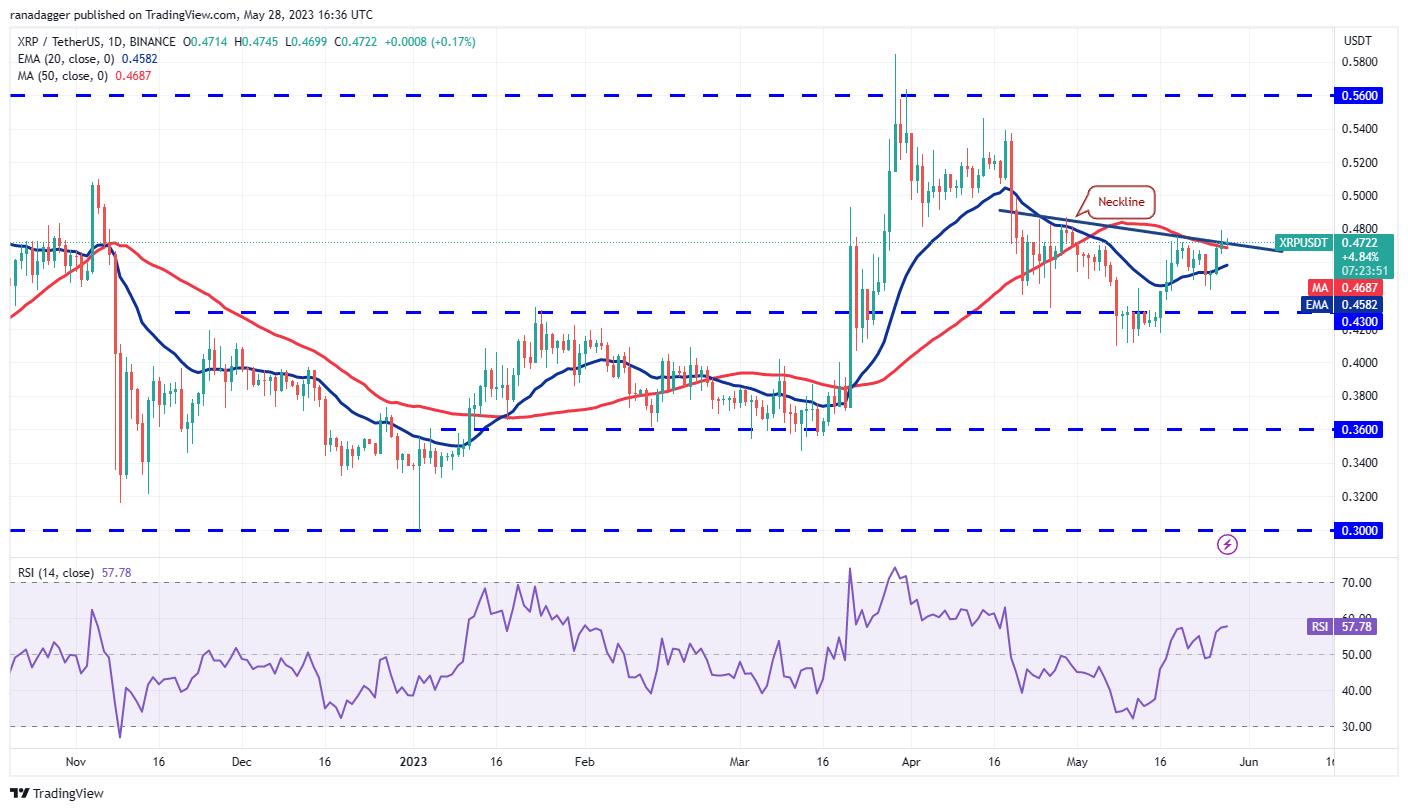
The 20-day EMA ($0.45) is sloping up gradually and the RSI has jumped into positive territory, indicating that the path of least resistance is to the upside. If bulls drive and sustain the price above the neckline, the XRP/USDT pair could start a rally to the overhead resistance zone between $0.54 and $0.58. The pattern target of the bullish setup is $0.55.
This positive view will be negated in the near term if the price turns down from the neckline and plummets below the 20-day EMA. The pair could then descend to the important support near $0.40.
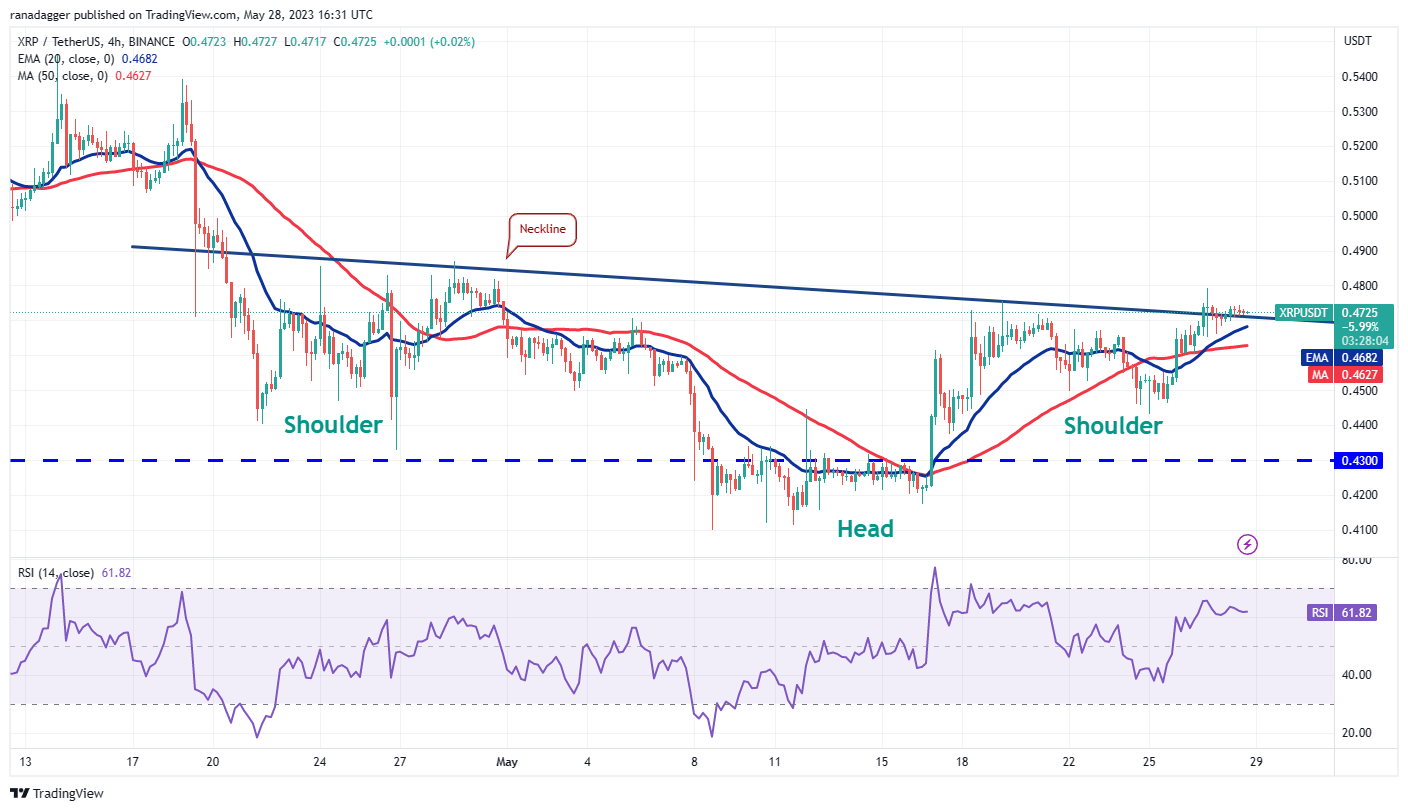
The 4-hour chart shows that the pair is witnessing a tough battle between the bulls and the bears near the neckline. The rising 20-EMA and the RSI in the positive zone indicate a minor advantage to the buyers.
If the price rebounds off the 20-EMA, it will increase the likelihood of a break above $0.48. If that happens, the pair is likely to start its up-move. Alternatively, if the price turns down and breaks below the moving averages, it will tilt the short-term advantage in favor of the bears. The pair may then drop to $0.44.
Arbitrum price analysis
The bulls pushed Arbitrum (ARB) back above the 20-day EMA ($1.17) on May 28, indicating the start of a potential recovery.
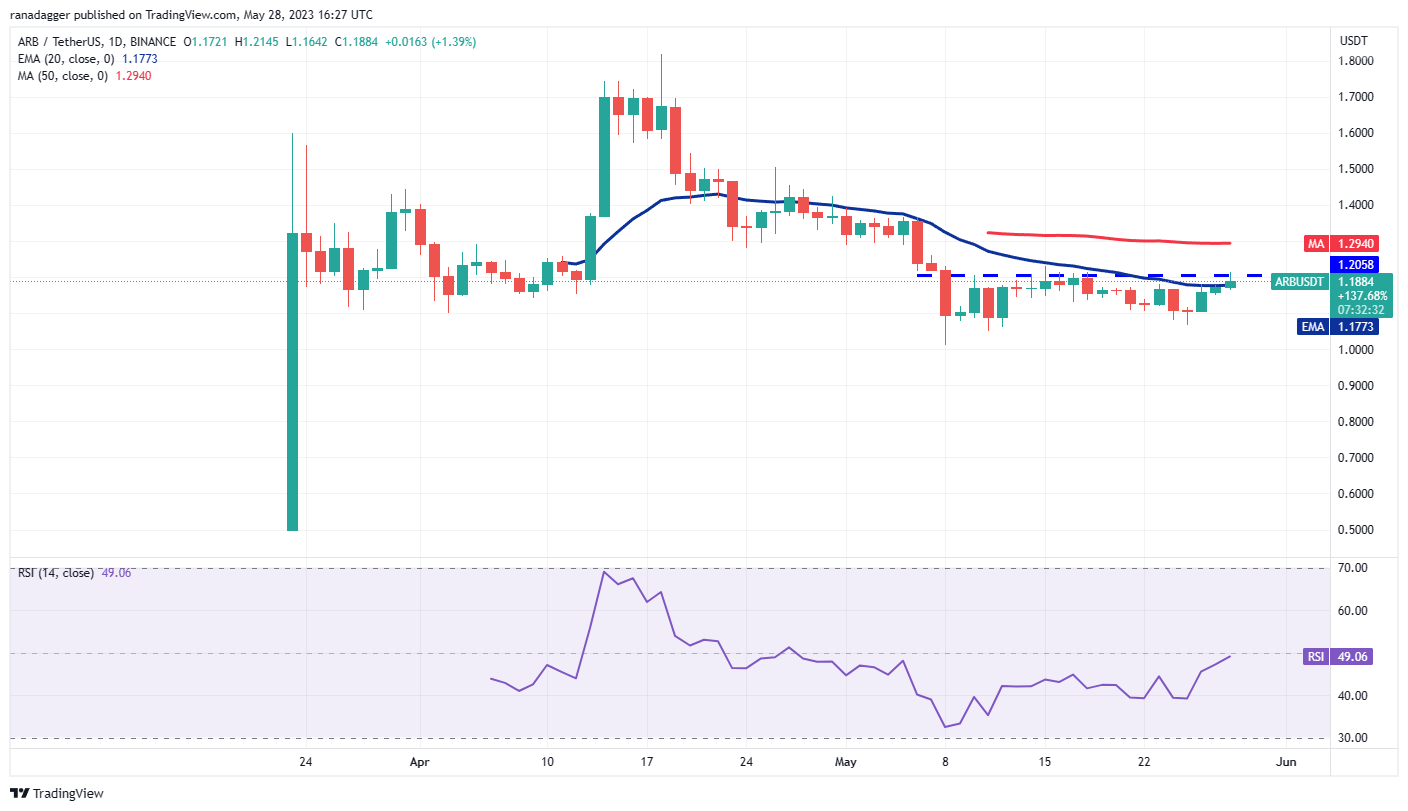
The bears are likely to pose a strong challenge at $1.20 but if bulls pierce this level, the ARB/USDT pair could pick up momentum. There is a minor resistance at the 50-day simple moving average ($1.29) but it is likely to be crossed. The pair may then climb to $1.36 and later to $1.50.
If bulls want to prevent the rally, they will have to quickly pull the price back below the 20-day EMA. If they manage to do that, the pair may slip to $1.06 and then to $1.01. This is an important zone for the bulls to defend because if it cracks, the pair may witness a sharp fall to $0.73.
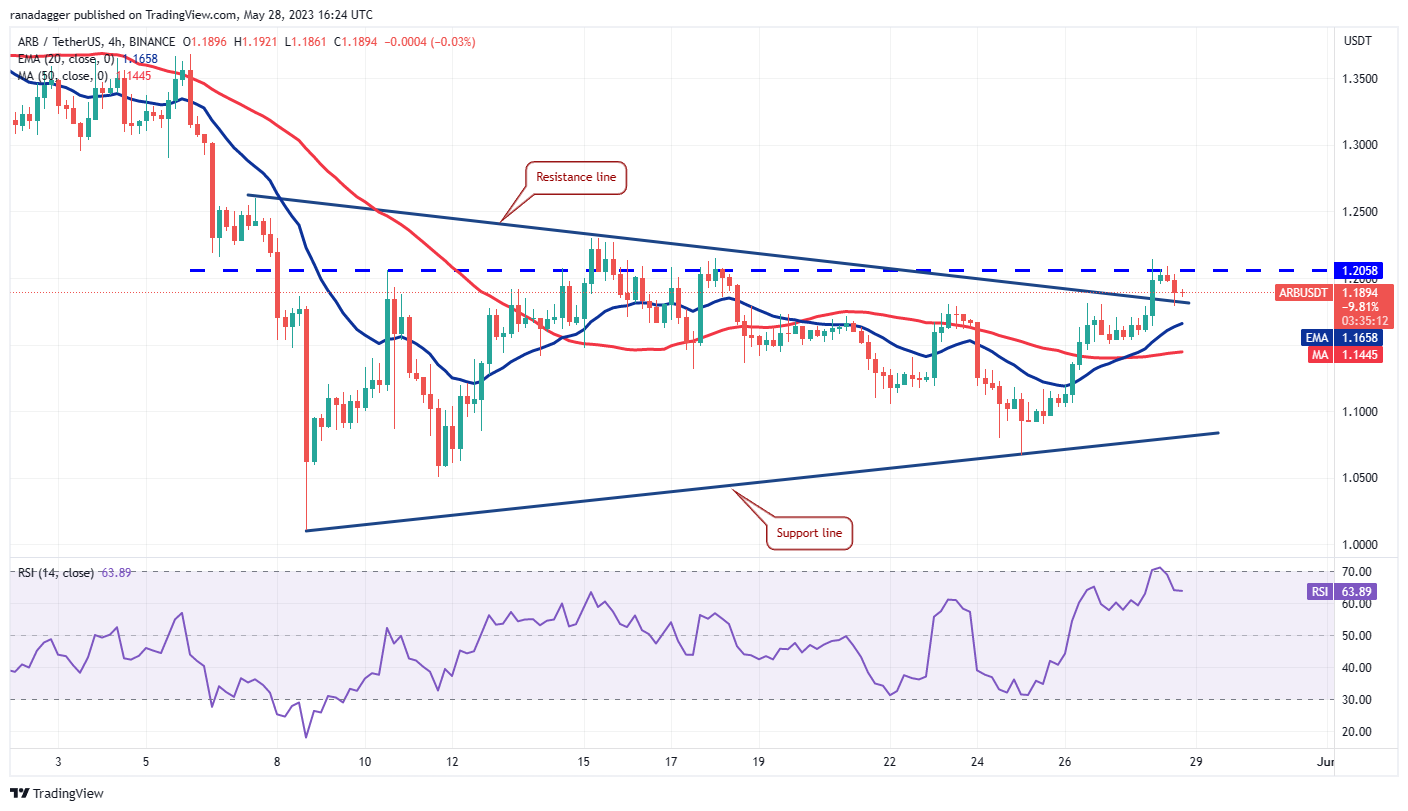
The 4-hour chart shows that the bulls have pushed the price above the resistance line of the symmetrical triangle pattern. The bears are trying to stall the up-move at $1.20 but if the bulls do not allow the price to re-enter the triangle, it will enhance the prospects of an upside breakout. The pattern target of the setup is $1.43.
Contrarily, if the price turns down and breaks back into the triangle, it will suggest that the recent breakout may have been a bull trap. The bears will then try to sink the price back toward the support line of the triangle.
Related: Institutions seek detailed blockchain analytics for crypto adoption — Elliptic
EOS Token price analysis
Eos (EOS) has been oscillating between $0.78 and $1.34 for the past several months. Generally, in such a large range, traders buy near the support and sell close to the resistance.
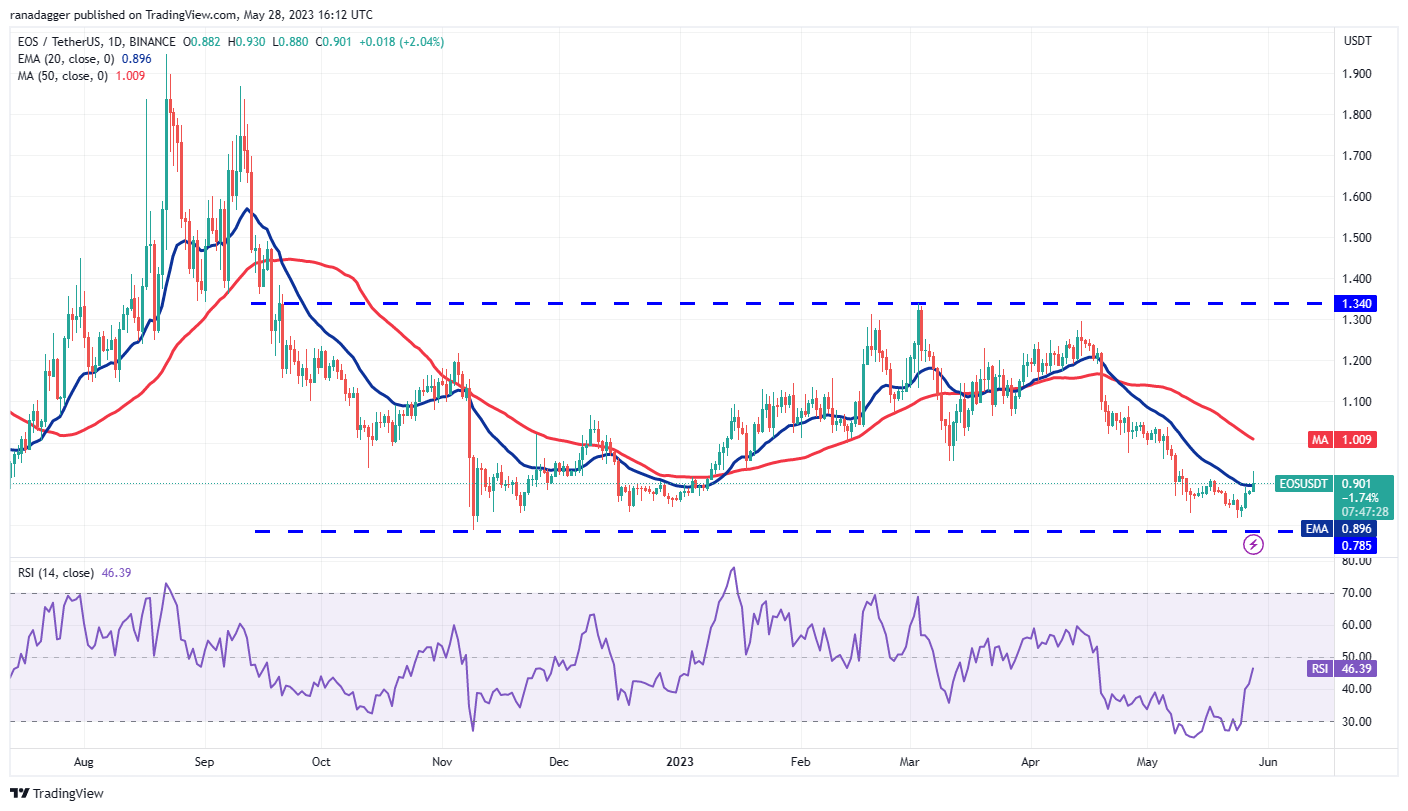
The EOS/USDT pair bounced off $0.81 on May 25 and rose above the 20-day EMA ($0.89) on May 28. This is the first indication that the range remains intact. The bulls will try to push the price to the 50-day SMA ($1) where the bears are likely to mount a strong defense.
If the next dip finds support at the 20-day EMA, it will suggest that the bulls are on top. The pair could then rise to $1.11. The bears will have to tug the price below the vital support at $0.78 to indicate the start of a downtrend.
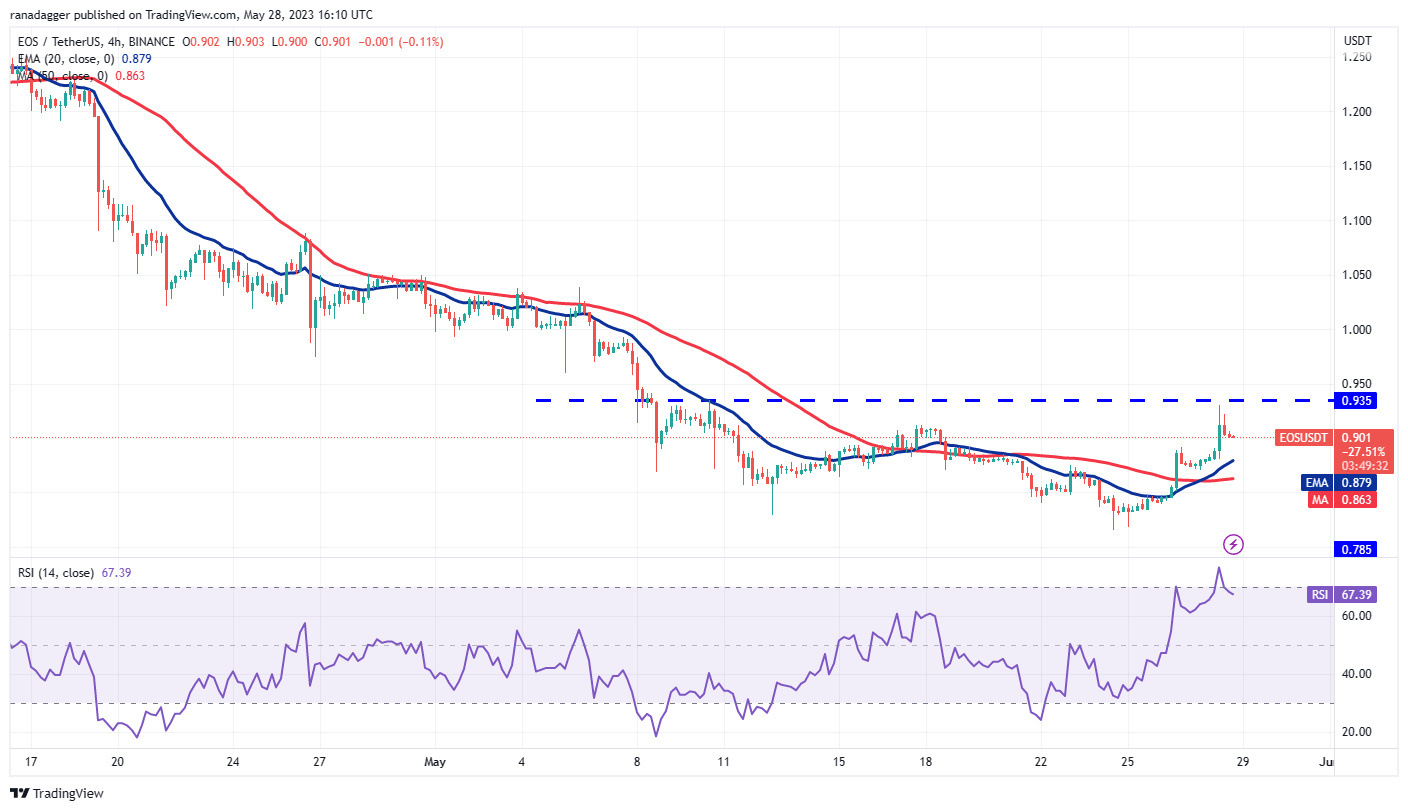
The recovery attempt is facing selling near the overhead resistance at $0.93 but the bulls have not given up much ground. The moving averages have completed a bullish crossover and the RSI is near the overbought zone, indicating that bulls have the upper hand.
If buyers drive the price above $0.93, the pair could pick up momentum and rise toward the psychological level of $1 and subsequently to $1.11. This positive view could invalidate in the near term if the price turns down and breaks below the moving averages.
Aave price analysis
Aave (AAVE) has been falling inside a descending channel pattern, which generally behaves as a bullish setup.
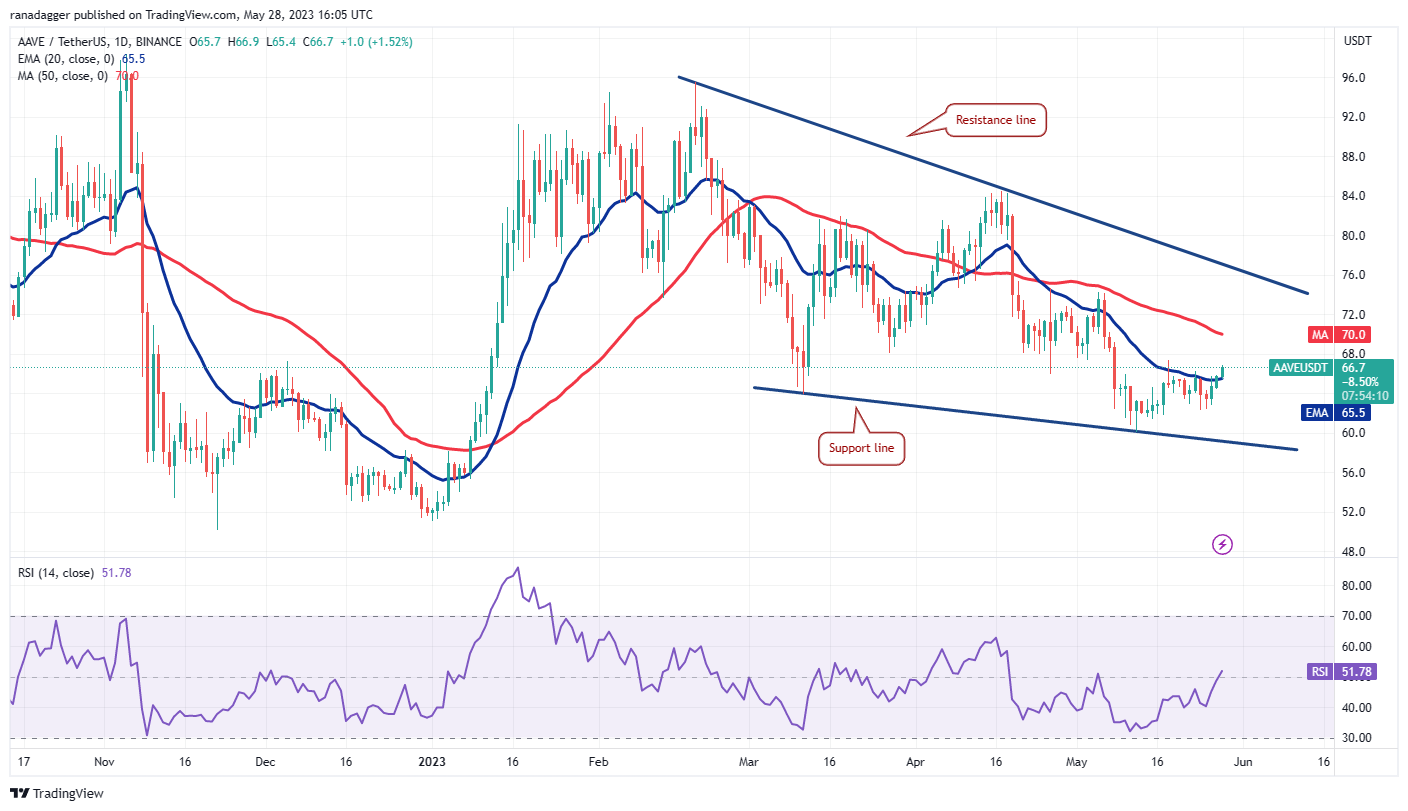
After struggling near the 20-day EMA ($65.50) for the past few days, the bulls pushed the price above the resistance on May 27. This suggests the start of a possible relief rally.
The AAVE/USDT pair could first rise to the 50-day SMA ($70) and thereafter attempt a rally to the resistance line. A break and close above this level may start a short-term up-move.
Contrary to this assumption, if the price turns down from the current level and breaks below the 20-day EMA, it will suggest that demand dries up at higher levels. The next support on the downside is at $62.
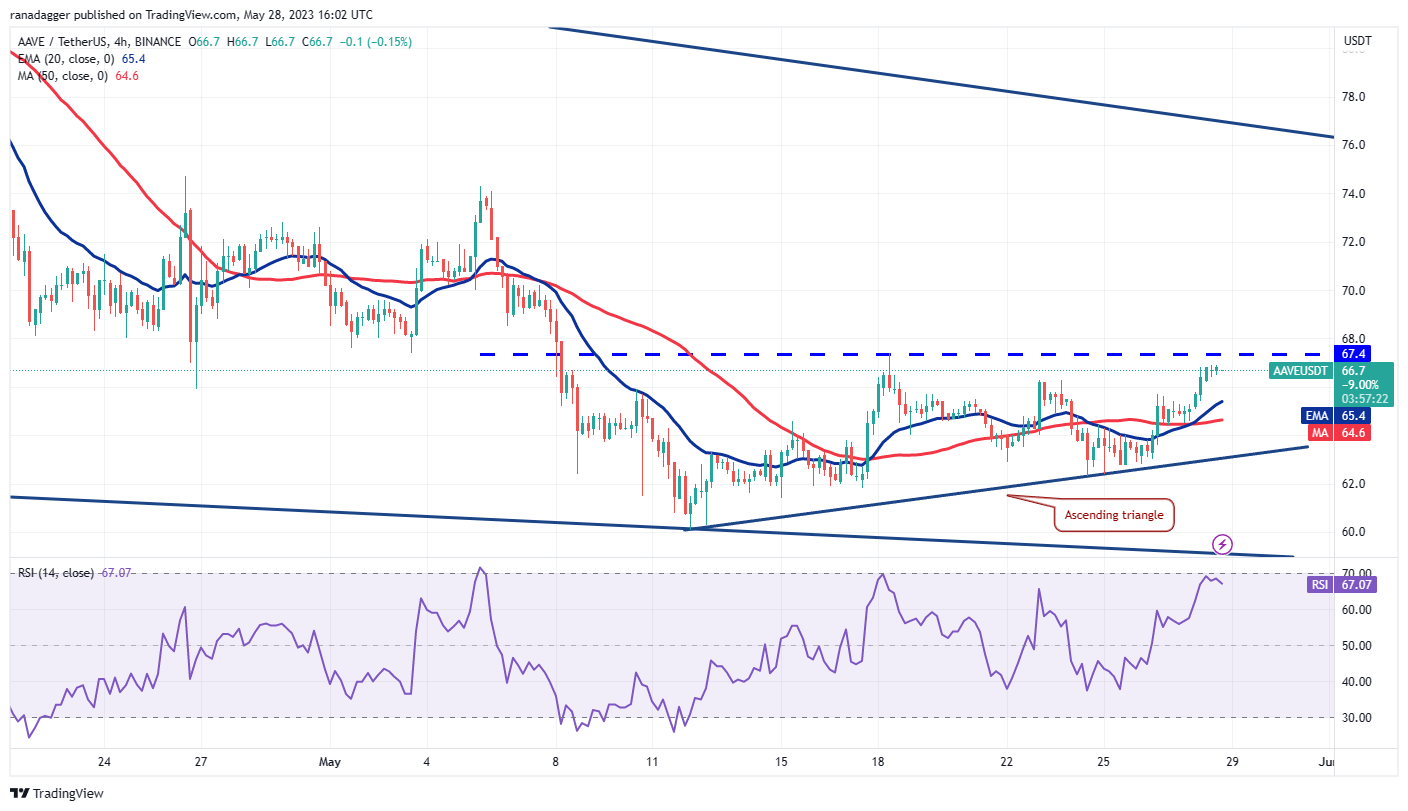
The 4-hour chart shows the formation of an ascending triangle pattern which will complete on a break and close above $67.40. The pair could then start an up-move toward the pattern target of $74.
Instead, if the price turns down from the current level, it will indicate that bears are fiercely protecting the $67.4 level. If the price slips below the moving averages, it will suggest that the pair may remain inside the triangle for some more time. A break below the triangle will invalidate the positive setup, tilting the advantage in favor of the bears.
This article does not contain investment advice or recommendations. Every investment and trading move involves risk, and readers should conduct their own research when making a decision.
This article is for general information purposes and is not intended to be and should not be taken as legal or investment advice. The views, thoughts, and opinions expressed here are the author’s alone and do not necessarily reflect or represent the views and opinions of Cointelegraph.
Source link

Uniswap Bullish But Struggles With Resistance, Potential For More Gains?

Nevada financial regulator petitions court to place Prime Trust into receivership

BTC Continues Uptrend As Fidelity Plans To Submit Bitcoin Spot ETF Filing

New Web3 ID app lets users find each other based on proven interests

PEPE Coin Shines Among Top Gainers, Tallies 78% In Last Week

Japanese and Singaporean regulators join forces on crypto pilot project

Bitcoin Holders Expect Retrace, Will BTC Move Against Crowd Once Again?

Bitcoin bulls grill $31K as Fidelity ETF move fuels BTC price strength

Robinhood To Lay Off 7% of Full-Time Staff In Latest Restructuring

Google says its next AI ‘Gemini’ will be more powerful than ChatGPT

ETHBTC Hit A 300-Day Low

Digital pound will be pseudonymous with a focus on privacy: BoE CBDC chief

Tezos Releases Nairobi, XTZ Bulls Unmoved As Bears Dominate

Will $30K be a new springboard for Bitcoin bulls?

TRX Could Surge And Revisit $0.085

Judge rules LBRY video platform’s token is a security in case brought by the US SEC

Silvergate Capital’s crypto-to-fiat transfers decrease by $50B compared to Q3 2021

Will the Bitcoin mining industry collapse? Analysts explain why crisis is really opportunity

Exchange Outflows Shows Bitcoin, Ethereum Accumulation Trend Continues

Bitcoin Dropped Below 2017 All-Time-High but Could Sellers be Getting Exhausted? – Blockchain News, Opinion, TV and Jobs
BNM DAO Token Airdrop

What does the Coinbase Premium Gap Tell us about Investor Activity? – Blockchain News, Opinion, TV and Jobs
Fed policy and crumbling market sentiment could send the total crypto market cap back under $1T
New Minting Services

Can Cardano’s July hard fork prevent ADA price from plunging 60%?

SEC’s Chairman Gensler Takes Aggressive Stance on Tokens – Blockchain News, Opinion, TV and Jobs

Friends or Enemies? – Blockchain News, Opinion, TV and Jobs

LUNA2 Recovers 70% In Nine Days From Historic Lows

Enjoy frictionless crypto purchases with Apple Pay and Google Pay | by Jim | @blockchain | Jun, 2022

Block News Media Live Stream
-
 SEC8 months ago
Judge rules LBRY video platform’s token is a security in case brought by the US SEC
-
 Banking8 months ago
Silvergate Capital’s crypto-to-fiat transfers decrease by $50B compared to Q3 2021
-
 Antminer11 months ago
Will the Bitcoin mining industry collapse? Analysts explain why crisis is really opportunity
-
 Bitcoin8 months ago
Exchange Outflows Shows Bitcoin, Ethereum Accumulation Trend Continues
-
 Altcoins12 months ago
Bitcoin Dropped Below 2017 All-Time-High but Could Sellers be Getting Exhausted? – Blockchain News, Opinion, TV and Jobs
-
Uncategorized1 year ago
BNM DAO Token Airdrop
-
 Binance11 months ago
What does the Coinbase Premium Gap Tell us about Investor Activity? – Blockchain News, Opinion, TV and Jobs
-
 Asia11 months ago
Fed policy and crumbling market sentiment could send the total crypto market cap back under $1T