
Bitcoin price
Bitcoin Price Takes A Beating Below $25K Amid Fed Hawkish Tone

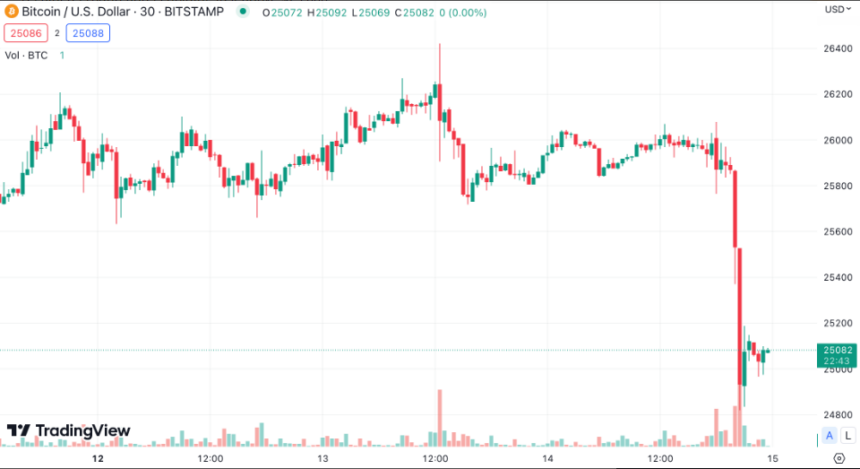
For the first time since mid-March, Bitcoin price dropped below $25,000 as trade volumes decreased and the U.S. Federal Reserve left interest rates untouched based on projections but warned of additional hikes this year to combat inflation.
At the time of writing, Bitcoin was trading at $24,995, down 3.8% in the last 24 hours, data from crypto market tracker CoinMarketCap shows. BTC has now lost 5.26% of its value in the last seven days. Crypto assets may be particularly vulnerable to the central bank’s projection of a higher terminal rate later this year.

Source: CoinMarketCap
Bitcoin price had been stable around $26,000 for the past few days as the market processed the SEC’s lawsuit against Binance and Coinbase and rising macroeconomic anxiety about interest rate signals from the Fed.
SEC Lawsuits, Hawkish Fed Message Hammer Bitcoin Price
According to Benjamin Stani, head of business development and sales at cryptocurrency trading platform Matrixport, the SEC’s lawsuit against the two largest cryptocurrency exchanges is a major factor in the market’s recent losses. The majority of altcoins also took a beating in value as a result.
CoinMarketCap data shows that in the past 24 hours, the entire cryptocurrency market cap has dropped 2.7%, to $1.02 trillion, while daily crypto trading volume has decreased 5.3% to $31.89 billion.
BTCUSD drops to the $24K level. Chart: TradingView.com
Despite widespread expectations for a rate suspension, the Federal Open Markets Committee signaled future rate hikes in its statement, which normally dampens investor enthusiasm for risk assets like cryptocurrencies.
Since early 2022, the US central bank has been gradually increasing interest rates, with the most severe effects seen by the riskiest assets. When interest rates rise, it becomes more expensive to borrow money, which leads to lower levels of investment and consumer spending.
And because of the prolonged crypto winter, Bitcoin has been plunging since the beginning of the year. Analysts say it may take awhile for the alpha coin to muster a strong rebound and break past the key $27K or $28K level given the cryptocurrency’s sluggish performance of late.
Sluggish XRP Creates Negative Ripples Across Bitcoin Market
Add to the ongoing misery for Bitcoin is the disappointment emanating from the XRP community following the release of the Hinman documents, that many expected would be a savior of sorts to the price of the token and its creator Ripple, whose legal tussle with the SEC has yet to see closure.
BTC price on a downward trajectory. Source: TradingView.
These Hinman emails are critical in the ongoing case between Ripple and SEC. Whatever negative news comes out of it affects Bitcoin price – and crypto in general – in many ways.
Meanwhile, as technical factors play out, IntoTheBlock reports that Bitcoin-related negativity on Twitter has reached an all-time high. It emphasizes the relevance of this fact, which is that large peaks have typically occurred just before or after price lows in the past.
Santiment, an on-chain analytics company, also reports that the number of Bitcoins available for trading has hit a new low not seen since February 2018. Even while lawsuits continue against Binance and Coinbase, it has been reported that traders have continued to move BTC into self-custody.
Featured image from Pixels
Source link


Bitcoin price is correcting gains from the $31,400 zone. BTC could revisit the $29,200 support or even $28,500 before it starts a fresh increase.
- Bitcoin is currently correcting gains from the $31,400 zone.
- The price is trading below $30,500 and the 100 hourly Simple moving average.
- There is a connecting bearish trend line forming with resistance near $30,550 on the hourly chart of the BTC/USD pair (data feed from Kraken).
- The pair could continue to correct lower toward the $29,200 support or $28,500.
Bitcoin Price Starts Downside Correction
Bitcoin price remained well-bid above the $29,500 resistance zone. BTC cleared the $30,000 resistance to move further into a positive zone. Finally, there was a push above the $31,000 zone.
The price tested the $31,500 zone. A high is formed near $31,435 and the price is now correcting lower. There was a move below the $30,500 level. The price traded below the 50% Fib retracement level of the upward move from the $29,550 swing low to the $31,435 high.
Bitcoin price is now trading below $30,500 and the 100 hourly Simple moving average. There is also a connecting bearish trend line forming with resistance near $30,550 on the hourly chart of the BTC/USD pair.
The pair is trading close to the 76.4% Fib retracement level of the upward move from the $29,550 swing low to the $31,435 high. If the price remains stable above the $30,000 level, it could soon start a fresh increase. On the upside, the price is facing resistance near the $30,400 level and the 100 hourly Simple moving average.
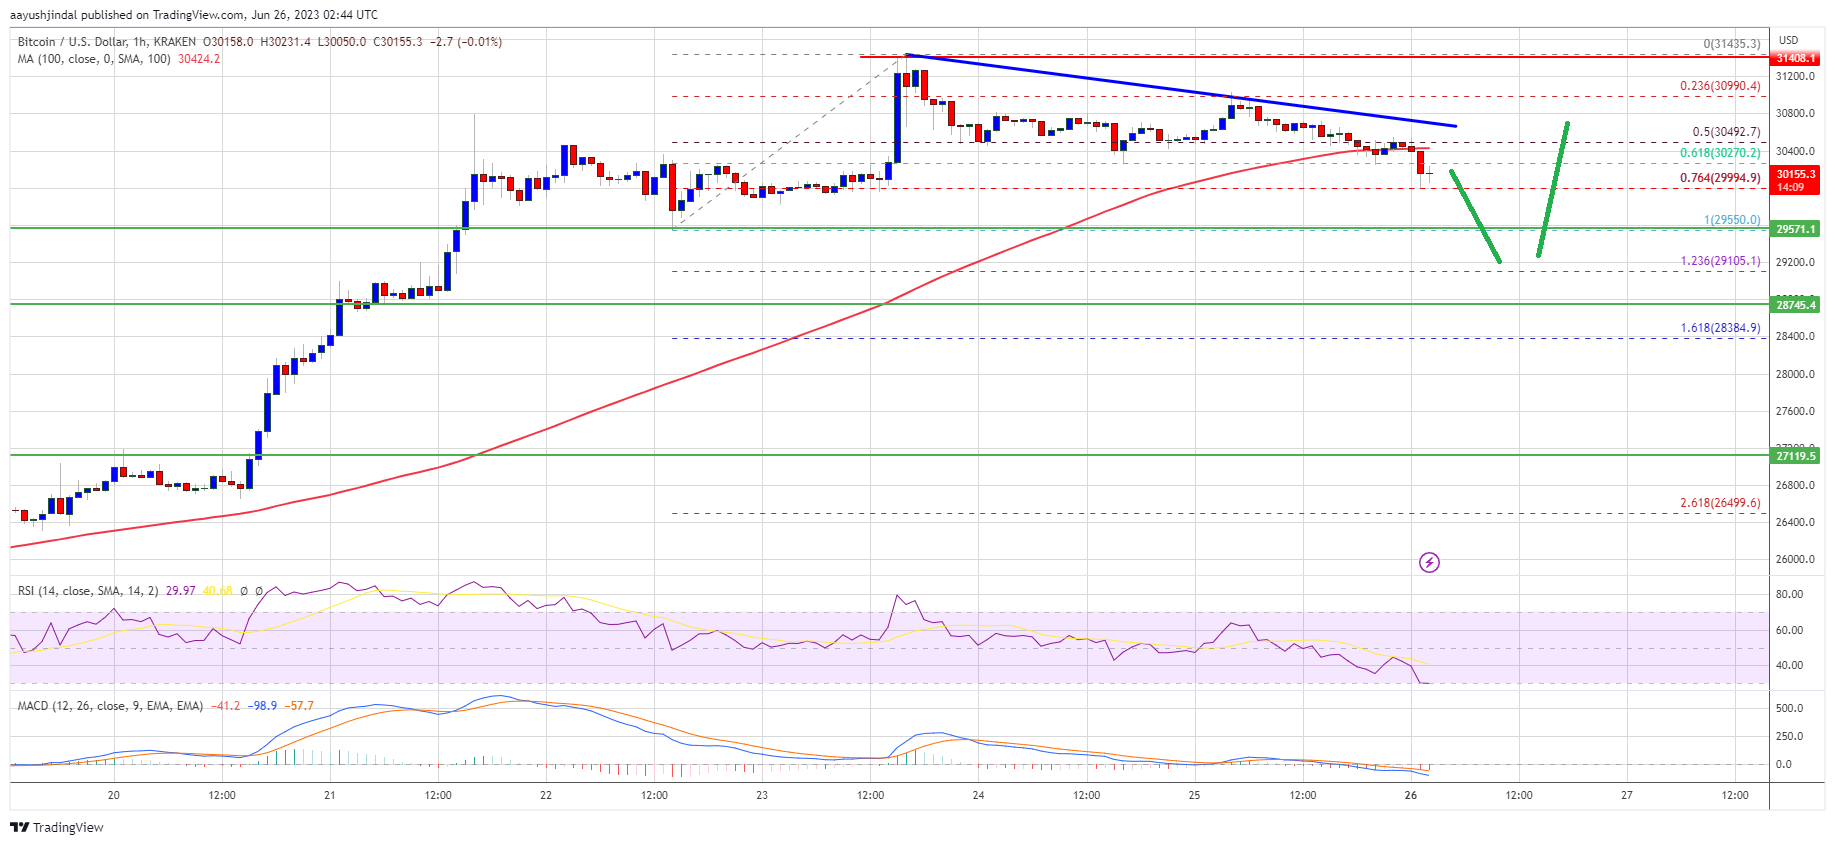
Source: BTCUSD on TradingView.com
The first major resistance is near the $30,550 level and the trend line, above which the price might revisit the $31,400 resistance zone. The next major resistance is near the $32,000 level. Any more gains could send the price toward the $32,500 resistance zone.
More Downsides in BTC?
If Bitcoin’s price fails to clear the $30,550 resistance, it could continue to move down. Immediate support on the downside is near the $30,000 level.
The next major support is near the $29,550 level, below which there is a risk of a move toward the $29,200 support. Any more losses might send the price toward $28,500 in the near term.
Technical indicators:
Hourly MACD – The MACD is now gaining pace in the bearish zone.
Hourly RSI (Relative Strength Index) – The RSI for BTC/USD is below the 50 level.
Major Support Levels – $30,000, followed by $29,550.
Major Resistance Levels – $30,400, $30,550, and $31,400.
Source link
By the completion of its daily candle on Wednesday, Bitcoin had gained over 18% in just seven consecutive sessions, abruptly ending the steady drift lower which had dominated its price action since Bitcoin put in its mid-April high above 30,000. How unusual is this magnitude gain in only a week’s time, and what’s happened in the past after similarly robust rallies? Let’s take a closer look at Bitcoin’s price history to find out.
Bitcoin’s Price History Suggests Higher Prices Ahead
As we examine Bitcoin’s price history for which there is reliable data (2011 to the present), the number one cryptocurrency by market cap has experienced numerous instances of gains greater than or equal to +18% over the span of seven days.
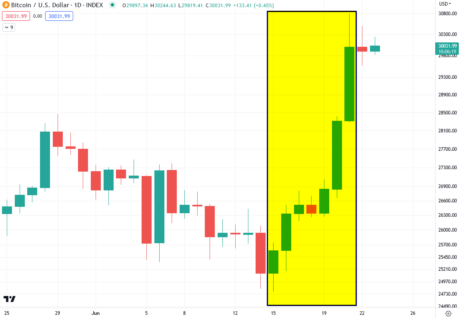
Bitcoin gains >= 18% in Seven Days | BTCUSD on TradingView.com
Because the number of occurrences will vary depending on holding time, we’ll start by listing the number of times this has happened next to our hypothetical hold times of 7 days through 90 days. Holding time is defined as the amount of time one held Bitcoin before exiting. For example, if one hypothetically purchased Bitcoin following the trigger event (i.e., +18% over the span of seven days) and sold it 30 days later, this would be a holding time of 30 days.
Bitcoin Occurrences of +18% Gains in Seven Consecutive Days by Holding Time (2011 – Present)
- 98 occurrences using a 7-day hold time
- 73 occurrences using a 15-day hold time
- 57 occurrences using a 30-day hold time
- 30 occurrences using a 90-day hold time
Clearly, gains of this magnitude in just a week’s time are not uncommon for Bitcoin, an asset with numerous instances of large price advances especially when considering its relatively short price history compared to traditional risk assets.
Bitcoin Results Slightly Less Bullish In Recent Years
While a gain of over 18% in such a brief time period may lead some traders to lean bearish, the data suggests otherwise, with historical average results clearly positive across the board for all holding times from 2011 to the present.
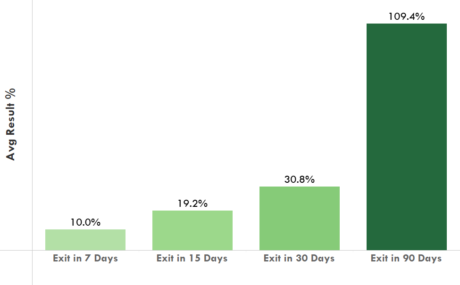
Bitcoin gains >= 18% in Seven Consecutive Days with Various Hold Times. 2011 – Present.
Because Bitcoin’s early price history experienced arguably outsized gains relative to its more recent history, let’s take a look at average results for the same degree of gains in a week’s time but only examining data for the last five years (6/23/18 to the present).
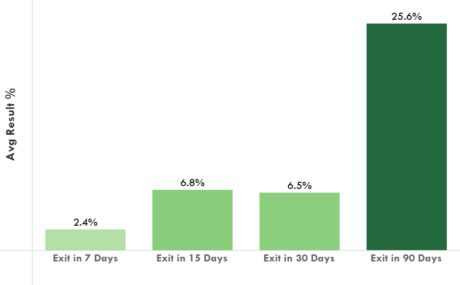
Bitcoin gains >= 18% in Seven Consecutive Days with Various Hold Times. Last Five Years.
While once again results are positive across the board, the hypothetical results over more recent data are significantly lower, with the average 90-day return of +25.6% over the past five years a far cry from the +109.4% returns for the same 90-day window over the full price history from 2011 to the present.
While some traders may argue that the past five years is less representative data due to the occurrence of two major bear markets for Bitcoin and crypto more broadly, Bitcoin has shown positive follow through on average for both time periods across all the hold times we examined. While the past does not predict the future, the recent powerful price advance appears to suggest that Bitcoin is poised for greater gains in relatively near future.
Source link

Bitcoin, the leading cryptocurrency by market capitalization, seems to have entered a phase of consolidation above the $30,000 mark following a notable surge of over 10% on Tuesday.
While the price movement has generated a lot of interest among investors, it remains uncertain whether Bitcoin will maintain its upward momentum or experience a pullback in the coming days.
Bitcoin Uncertain Trajectory
Ben Lilly, a well-known cryptocurrency analyst, and economist, recently shared his thoughts on the current state of Bitcoin’s price action and its potential future trajectory.
In a recent analysis, Lilly dubbed the current price movement the “Larry Fink Pump,” referencing the recent announcement by BlackRock’s CEO Larry Fink regarding the company’s increased interest and application for a Bitcoin spot ETF.
While the pump has caused some excitement among investors, Lilly notes that several factors could cause the rally to falter.
For one, Bitcoin has already wiped out the remaining high-leverage liquidity to the upside, and the Cumulative Volume Delta (CVD) spot seems to have lost its short-lived trend already.
Additionally, the fuel meter discussed in a recent Alpha Bites episode by Benjamin Skew of Jarvis Labs LLC has dropped significantly from its pre-pump levels, which could indicate a bearish case for Bitcoin in the short term.
Despite these potential bearish factors, Lilly remains optimistic about Bitcoin’s future. He notes that the $24,000 level is still sitting there and could be had if the price breaks the 200-day moving average, which is currently creeping above it. If this happens, he predicts that Bitcoin could drop to $21,000-$22,000.
However, Lilly also sees the possibility of an upside scenario for BTC. He notes that low-leverage liquidity sits at $32,000, and he would “love to see it taken out.”
Looking at the returns by trading session, he points out that the New York session seems to be leading the way. He notes that when the trend of the New York session ends, there’s a bit of a lag before the price responds to the downside, suggesting that the June options max pain of $25,000 may not happen.
Lilly also highlights the recent increase in the whale holding chart, as seen in the chart below, which indicates that large Bitcoin holders, commonly referred to as whales, are once again accumulating the cryptocurrency.
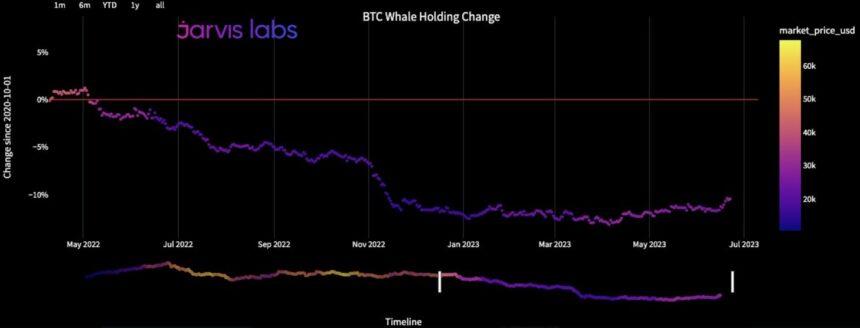
This is the first time a trend like this has been observed since mid-January, suggesting that there may have been significant accumulation happening before the recent surge in BTC’s price.
Related Reading: Is Chainlink The Most Undervalued Altcoin? It’s Do Or Die For LINK
Overall, Lilly concludes that investors should not be quick to fade this Bitcoin rally. While there are potential bearish factors at play, there are also several bullish indicators. Investors should track the data to see if the trend continues and be prepared for potential volatility events in the future.
At the time of writing, Bitcoin has maintained a stable price for several days. The cryptocurrency is currently trading at $30,100 and has managed to stay in positive territory, with a slight increase of 0.6% over the past 24 hours.
Featured image from Unsplash, chart from TradingView.com
Source link

TRX Could Surge And Revisit $0.085

Riot Platforms to add 33,000 Bitcoin miners ahead of 2024 halving

Injective (INJ) Continues To Build Momentum, Jumps Nearly 27% In A Single Week

$27 trillion AUM is perched over Bitcoin and crypto: CoinShares CSO

Ethereum Price Lacks Momentum Above $1,900 But Dips Likely To Be Limited

Robinhood to axe 7% of full-time staff in latest round of layoffs: Report

Crypto Investment Inflows Reach One-Year High, Reveals CoinShares

Yes, the Secret Service has an NFT collection, and no, it’s not for sale

How A Morning Star Pattern Could Awaken Altcoins

Swiss central bank announces plans for wholesale CBDC pilot with ‘real money’: Report

Chainlink Bulls Must Defend Support Zone To Prepare For Another Rally

What is generative AI?

Kaspa (KAS) Takes Altcoin Market By Storm With 60% Growth

Optimism network transactions surged 67% following Bedrock upgrade — Nansen

XRP Buybacks Were On The Table

Judge rules LBRY video platform’s token is a security in case brought by the US SEC

Silvergate Capital’s crypto-to-fiat transfers decrease by $50B compared to Q3 2021

Will the Bitcoin mining industry collapse? Analysts explain why crisis is really opportunity

Exchange Outflows Shows Bitcoin, Ethereum Accumulation Trend Continues

Bitcoin Dropped Below 2017 All-Time-High but Could Sellers be Getting Exhausted? – Blockchain News, Opinion, TV and Jobs
BNM DAO Token Airdrop

What does the Coinbase Premium Gap Tell us about Investor Activity? – Blockchain News, Opinion, TV and Jobs
Fed policy and crumbling market sentiment could send the total crypto market cap back under $1T
New Minting Services

Can Cardano’s July hard fork prevent ADA price from plunging 60%?

SEC’s Chairman Gensler Takes Aggressive Stance on Tokens – Blockchain News, Opinion, TV and Jobs

Friends or Enemies? – Blockchain News, Opinion, TV and Jobs

LUNA2 Recovers 70% In Nine Days From Historic Lows

Enjoy frictionless crypto purchases with Apple Pay and Google Pay | by Jim | @blockchain | Jun, 2022

Block News Media Live Stream
-
 SEC8 months ago
Judge rules LBRY video platform’s token is a security in case brought by the US SEC
-
 Banking8 months ago
Silvergate Capital’s crypto-to-fiat transfers decrease by $50B compared to Q3 2021
-
 Antminer11 months ago
Will the Bitcoin mining industry collapse? Analysts explain why crisis is really opportunity
-
 Bitcoin8 months ago
Exchange Outflows Shows Bitcoin, Ethereum Accumulation Trend Continues
-
 Altcoins12 months ago
Bitcoin Dropped Below 2017 All-Time-High but Could Sellers be Getting Exhausted? – Blockchain News, Opinion, TV and Jobs
-
Uncategorized1 year ago
BNM DAO Token Airdrop
-
 Binance11 months ago
What does the Coinbase Premium Gap Tell us about Investor Activity? – Blockchain News, Opinion, TV and Jobs
-
 Asia11 months ago
Fed policy and crumbling market sentiment could send the total crypto market cap back under $1T