
Bitcoin
Bitcoin Forms Bullish Butterfly Pattern, Targets $32,000
Bitcoin (BTC), the largest cryptocurrency in the market, is currently trading sideways after showing signs of recovery in the wake of the Securities and Exchange Commission (SEC) lawsuits against Binance and Coinbase.
Although BTC managed to briefly recover the $27,000 level on Tuesday, it has failed to consolidate above it and is now stuck in a narrow range between $26,300 and $26,600 over the last 24 hours.
The question on everyone’s mind now is whether Bitcoin will be able to regain its bullish momentum or if it will test its 200-day Moving Average (MA) at $25,200 once again.
Bitcoin Pattern Points To Further Bullish Momentum
Bitcoin traders and investors have reason to be optimistic, as the cryptocurrency appears to be forming a bullish butterfly pattern. According to technical analysis expert Mags, this harmonic reversal pattern is a strong indication of further potential upward movement for Bitcoin.
Related Reading: UK Financial Conduct Authority Clamps Down on Crypto Marketing
The bullish butterfly pattern is a type of harmonic reversal pattern that is often used by traders to identify potential trend changes in the markets. It is characterized by a series of price movements that form the shape of a butterfly, with a distinct “M” pattern followed by a smaller “W” pattern. The pattern is considered bullish because it suggests that the price of the asset is likely to reverse its previous downward trend and begin moving upward.
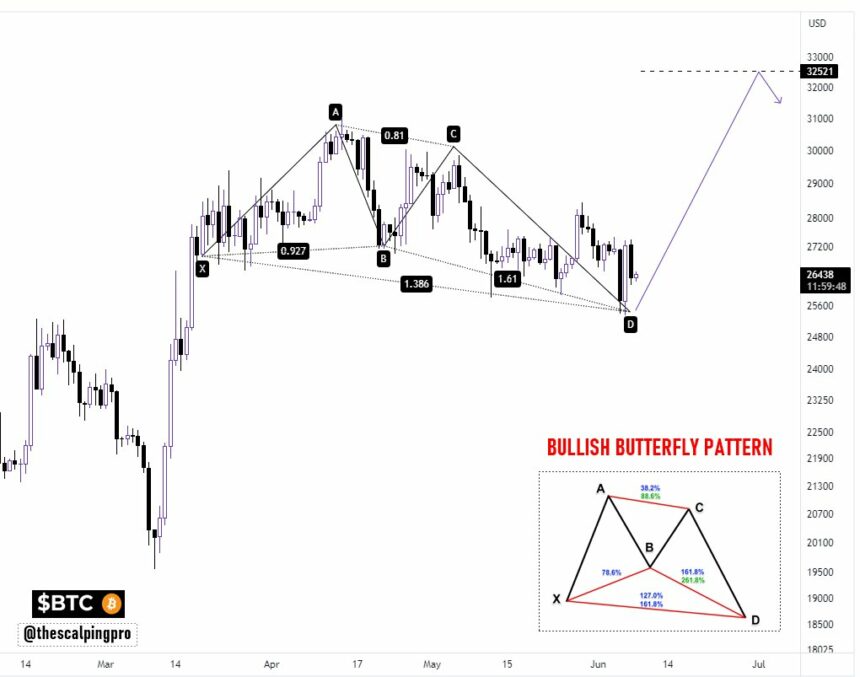
In Bitcoin’s case, the bullish butterfly pattern is signaling a potential target of around $32,500. This projection is based on the historical price movements of Bitcoin, as well as the shape and structure of the butterfly pattern itself. While no pattern is foolproof, the bullish momentum of Bitcoin in recent months lends further support to this target.
However, Bitcoin faces a potential challenge ahead, as it struggles to surpass its nearest resistance level at $27,500 and consolidate above it. If BTC fails to break through this price point, it may be vulnerable to retesting its 200-day Moving Average.
This key support level is crucial for BTC’s short-term bullish momentum, and failure to hold above it could lead to further price drops. In such a scenario, the $24,000 and $23,000 marks may become the next trading range for BTC. Currently, the bulls’ threshold in the short term is the 200-day MA, which will need to hold if BTC is to maintain its upward trend.
Short-Term BTC Liquidations Favor The Bulls
Recent data provided by ‘The King Fisher’ indicates that most Bitcoin liquidations are skewed to the upside, signaling possible upside movements in the near term for BTC.
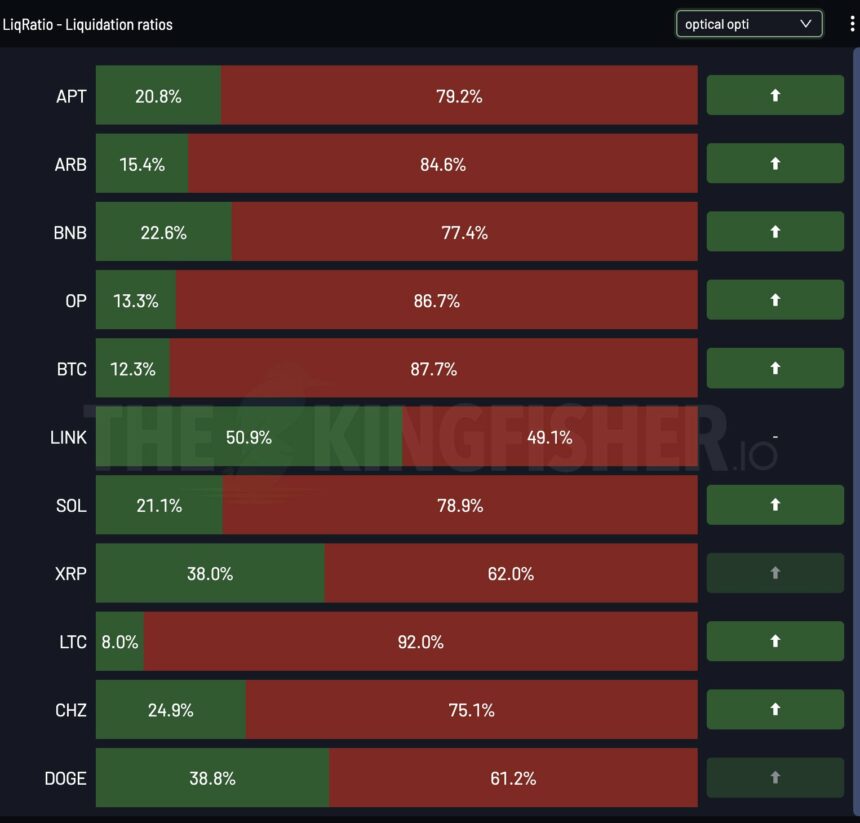
As seen in the chart above, the majority of Bitcoin positions in the past few days have been short positions, with 87% of traders betting on a price decrease, compared to only 12% who are bullish on an upward movement.
However, this situation may not favor BTC bears in the long run, as institutional investors historically take advantage of high levels of liquidations, which could lead to what is known as a “short squeeze,” to further fuel a movement in the opposite direction.
This dynamic could potentially fuel the bullish momentum that Bitcoin needs to break through its nearest resistance and regain the $30,000 level that was lost in April.
At the time of writing, Bitcoin has a trading value of $26,600, representing a modest gain of 0.8% over the past 24 hours. Bitcoin’s market capitalization currently stands at $516 billion.
Featured image from iStock, chart from TradingView.com
Source link


Bitcoin price is rising above the $26,500 resistance. BTC could gain bullish momentum if it settles above the $27,200 and $27,500 resistance levels.
- Bitcoin is slowly moving higher above the $26,500 resistance.
- The price is trading above $26,500 and the 100 hourly Simple moving average.
- There is a key bullish trend line forming with support near $26,600 on the hourly chart of the BTC/USD pair (data feed from Kraken).
- The pair could rise further if it clears the $27,200 and $27,500 resistance levels.
Bitcoin Price Eyes Sustained Upward Move
Bitcoin price managed to settle above the $26,000 resistance zone. BTC climbed higher steadily above the $26,200 and $26,500 resistance levels. It even spiked above the $27,000 level but there was a lack of bullish momentum.
A high is formed near $27,184 and the price is now correcting gains. There was a move below the $27,000 support. It is now trading below the 23.6% Fib retracement level of the recent increase from the $26,253 swing low to the $27,184 high.
Bitcoin price is now trading above $26,500 and the 100 hourly Simple moving average. Besides, there is a key bullish trend line forming with support near $26,600 on the hourly chart of the BTC/USD pair.
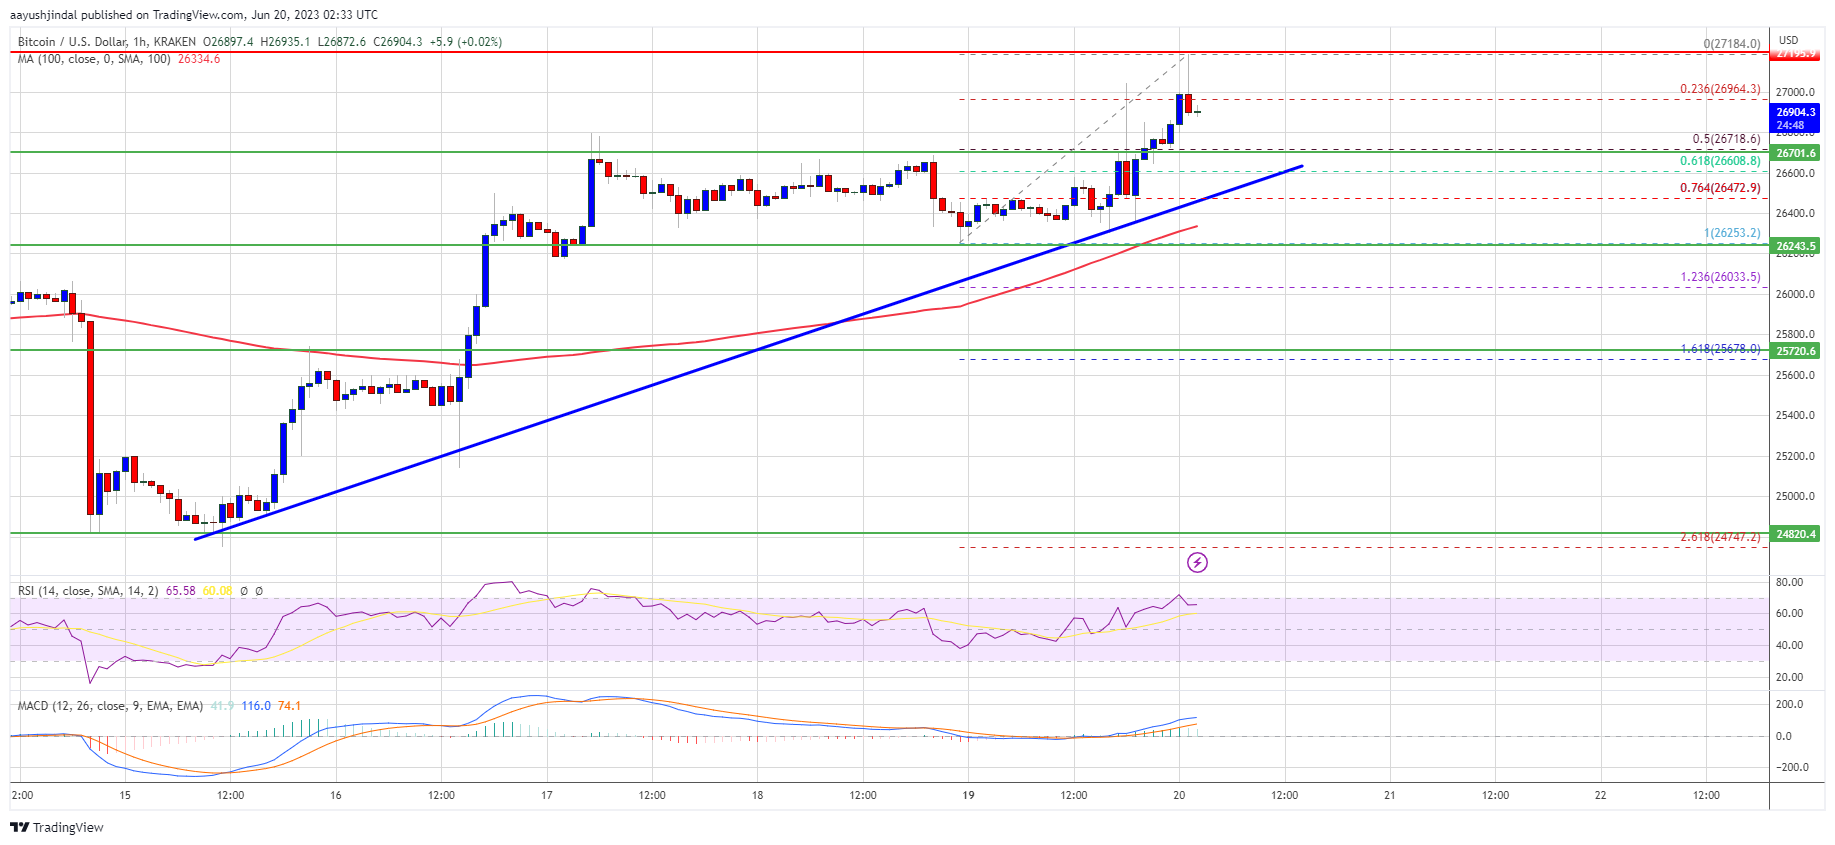
Source: BTCUSD on TradingView.com
On the upside, the price is facing resistance near the $27,200 level. The next major resistance is near the $27,500 level. A close above the $27,500 resistance might spark bullish moves in the near term. The next major resistance is near the $28,500 level, above which the bulls might send BTC toward the $29,200 resistance zone.
Are Dips Supported in BTC?
If Bitcoin’s price fails to clear the $27,200 resistance, it could continue to move down. Immediate support on the downside is near the $26,700 level.
The next major support is near the $26,600 level and the trend line. It is close to the 61.8% Fib retracement level of the recent increase from the $26,253 swing low to the $27,184 high. The main support is now near $26,250, below which the price might gain bearish momentum toward $25,750. Any more losses might send the price toward $25,200 in the near term.
Technical indicators:
Hourly MACD – The MACD is now losing pace in the bullish zone.
Hourly RSI (Relative Strength Index) – The RSI for BTC/USD is above the 50 level.
Major Support Levels – $26,600, followed by $26,250.
Major Resistance Levels – $27,200, $27,500, and $28,500.
Source link

After the Bitcoin price reached a three-month low of $24.835 last week, the bulls currently seem to be gaining the upper hand again. The BTC price has continued its upward trend in the last 24 hours and has risen by 1.6% to currently $26,795. At one point, BTC had already hit $27,203 before a corrective move took place.
Why Is Bitcoin Up Today?
As always, one can only speculate about the reasons why the Bitcoin price is rising. But thanks to the filing by BlackRock, the world’s largest asset manager, for a Bitcoin Spot ETF in the US, bullish sentiment has returned to the market. A Bitcoin Spot ETF is predicted to open the flood gates for institutional investors.
As NewsBTC reported, the history of the first gold ETF in the US in 2004 could be an indicator of the bullish impact that the approval of a spot ETF could have. The gold ETF has been instrumental in the adoption of gold by institutions. Within eight years of the first ETF, the price of gold more than quadrupled.
Basically, the US Securities and Exchange Commission has 240 days (about eight months) to decide on the application. However, David Attley, CEO of Bitcoin Magazine, asserted yesterday that he had heard a compelling argument that the BlackRock Bitcoin ETF could be approved shortly (“days to weeks”).
This news may have had as positive an impact on the market as yesterday’s news that Fidelity may also soon apply for a Bitcoin Spot ETF along the lines of BlackRock. Obviously, crypto Twitter has become much more bullish as a result of the BlackRock news.
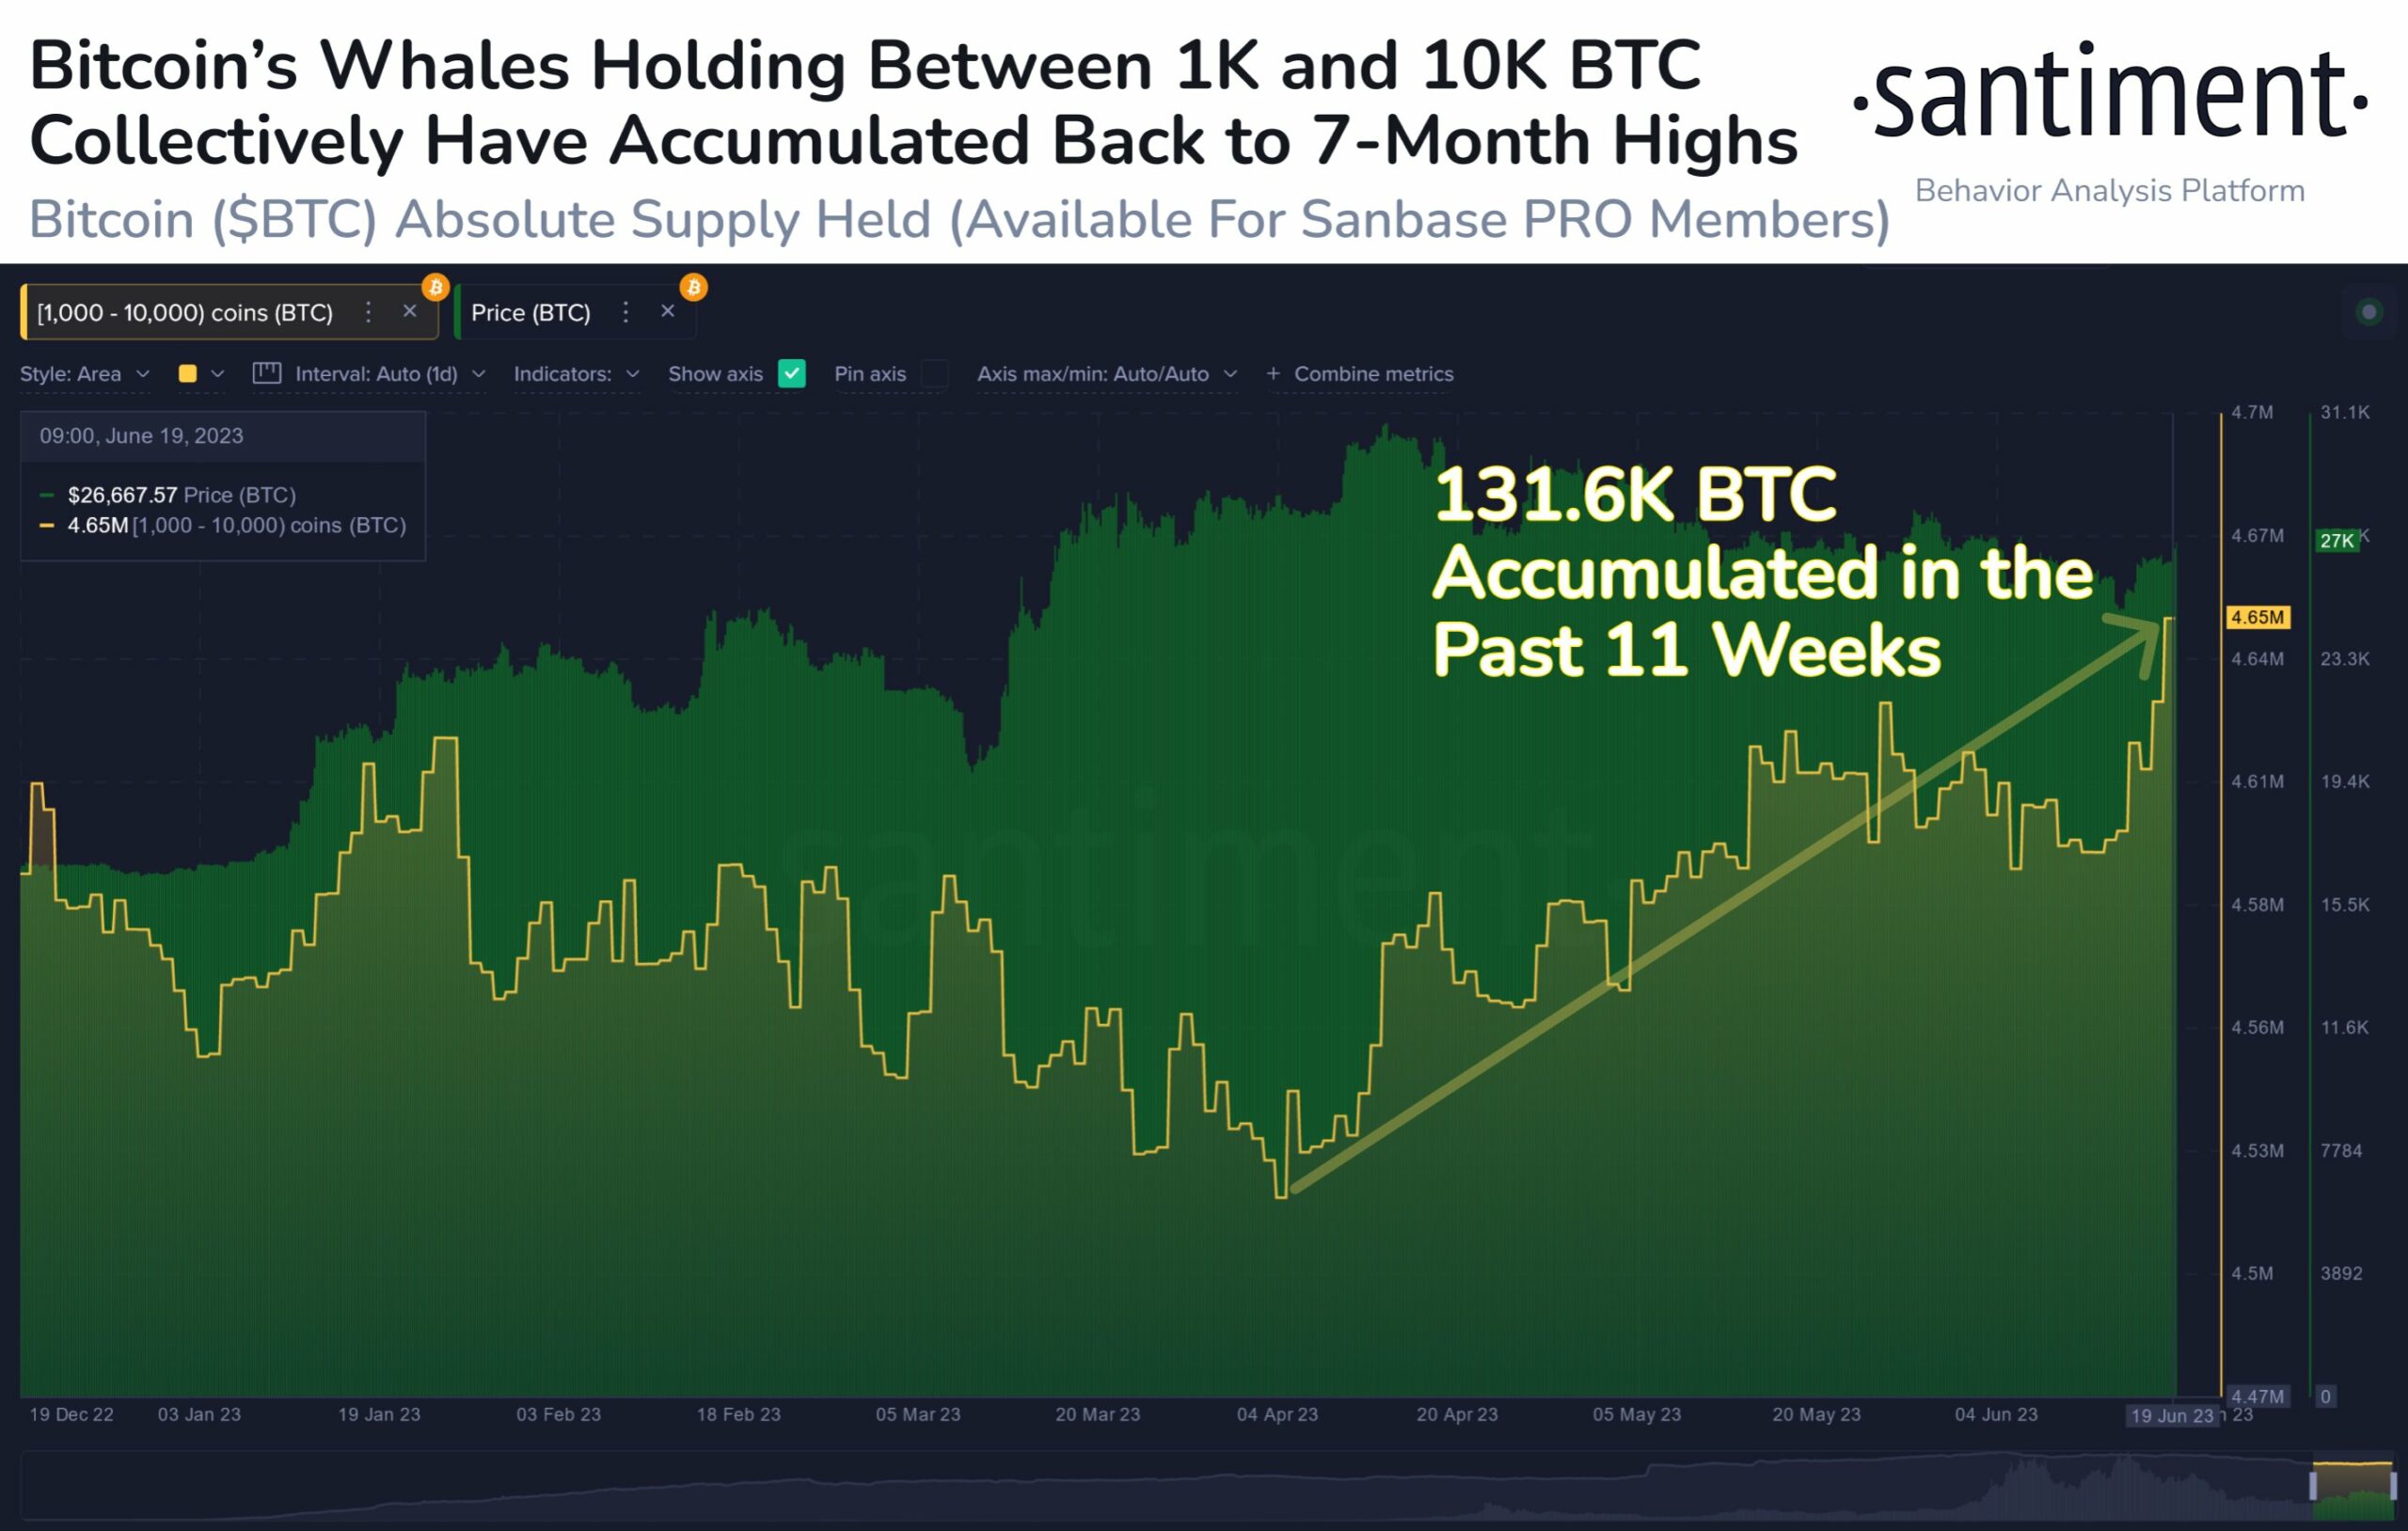
And large investors in BTC, so-called whales, have also turned bullish on the leading cryptocurrency for quite some time. As reported by on-chain data analytics service Santiment, whales have been busy over the past two months as the crowd watched the price fall.
“Now back above $27k once again, it’s far from coincidence that wallets holding 1K to 10K $BTC have accumulated a combined $3.5B since the first week of April,” Santiment states.
Intraday trader @52Skew makes a similar observation with regard to BTC perp CVD buckets & delta orders: “Whales mostly driving price still, longs aped on this bounce, shorts still twaping on every bounce.”
Moreover, the trader observed in the last few hours that there was a lot of demand in the spot market on Binance, the largest crypto exchange. According to him, spot buying is a sign of a sustained rally, so ideally spot buying needs to persist.
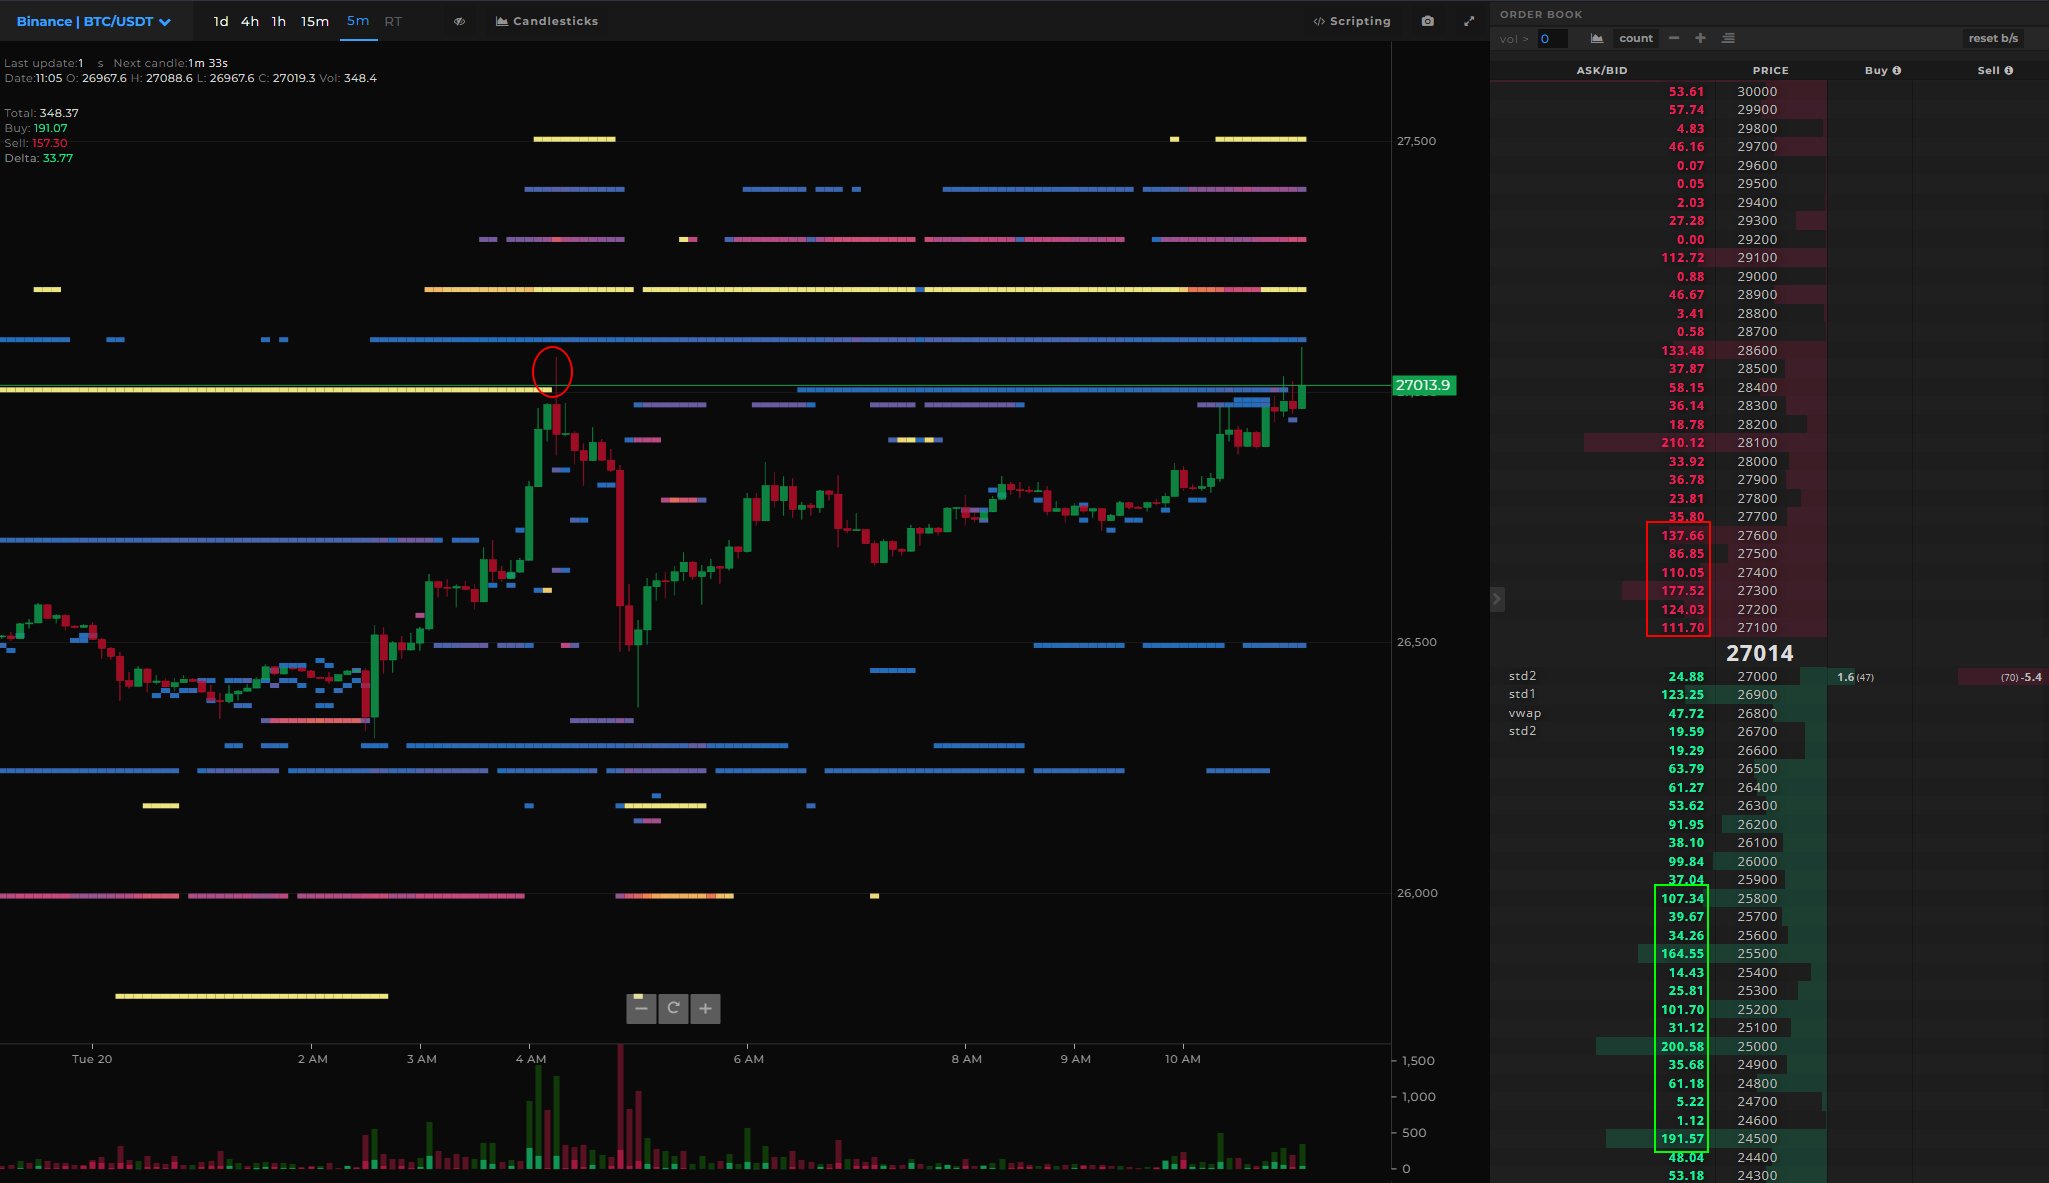
In terms of the Binance open interest and funding, Skew states that many shorts are chasing the price after the longs were squeezed earlier.
Outlook For H2 2023
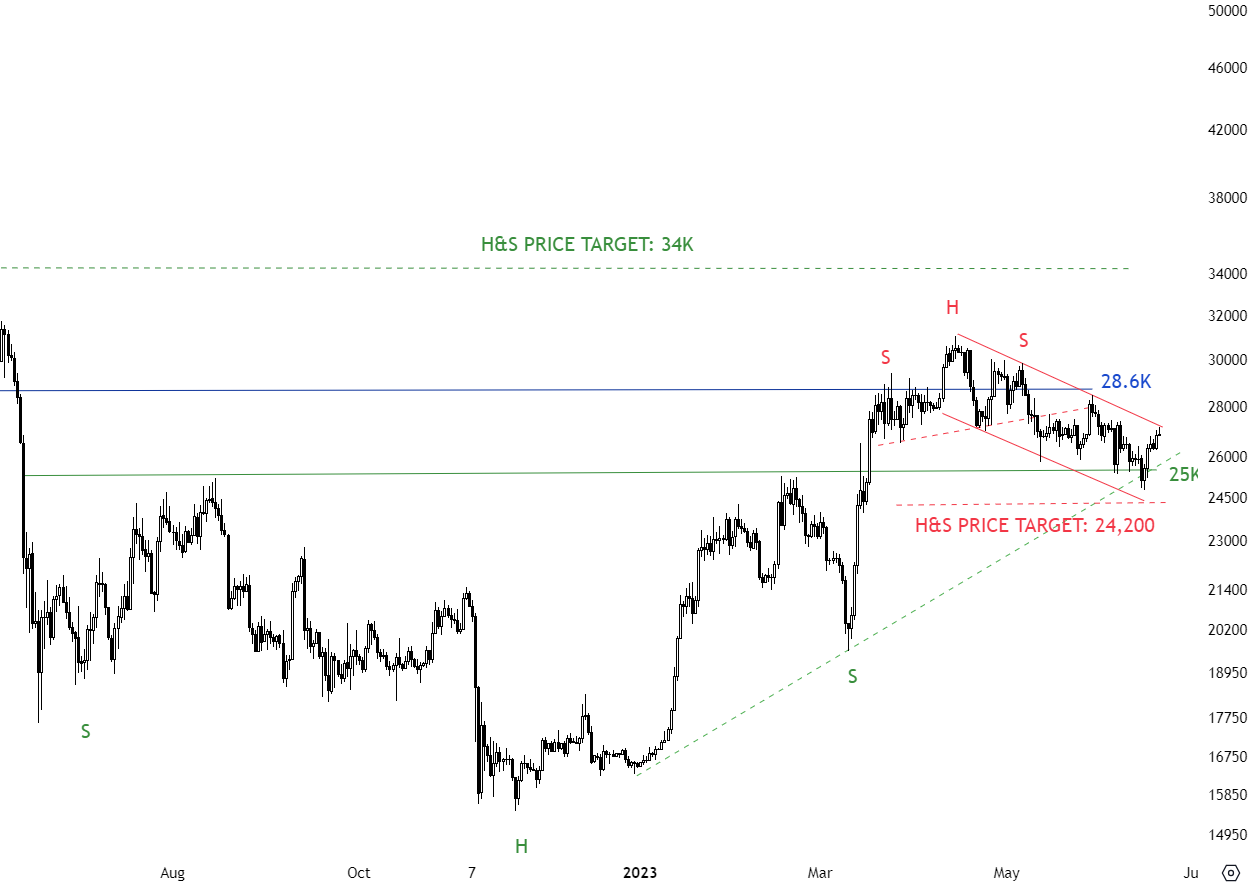
Another bullish impact on the market could be the technical chart outlook for the second half of the year. As Aksel Kibar, Chartered Market Technician (CMT), writes via Twitter, BTC could be on the verge of a breakout from the correction that has been taking place since mid-April:
Looks like we have a valid downward sloping channel on $BTCUSD with the upper boundary acting as short-term resistance at 27K. Breakout from the channel can complete the existing pullback to the larger scale H&S bottom reversal.
At press time, the Bitcoin price saw a slight correctional move and was trading at $26,795.
Featured image from iStock, chart from TradingView.com
Source link
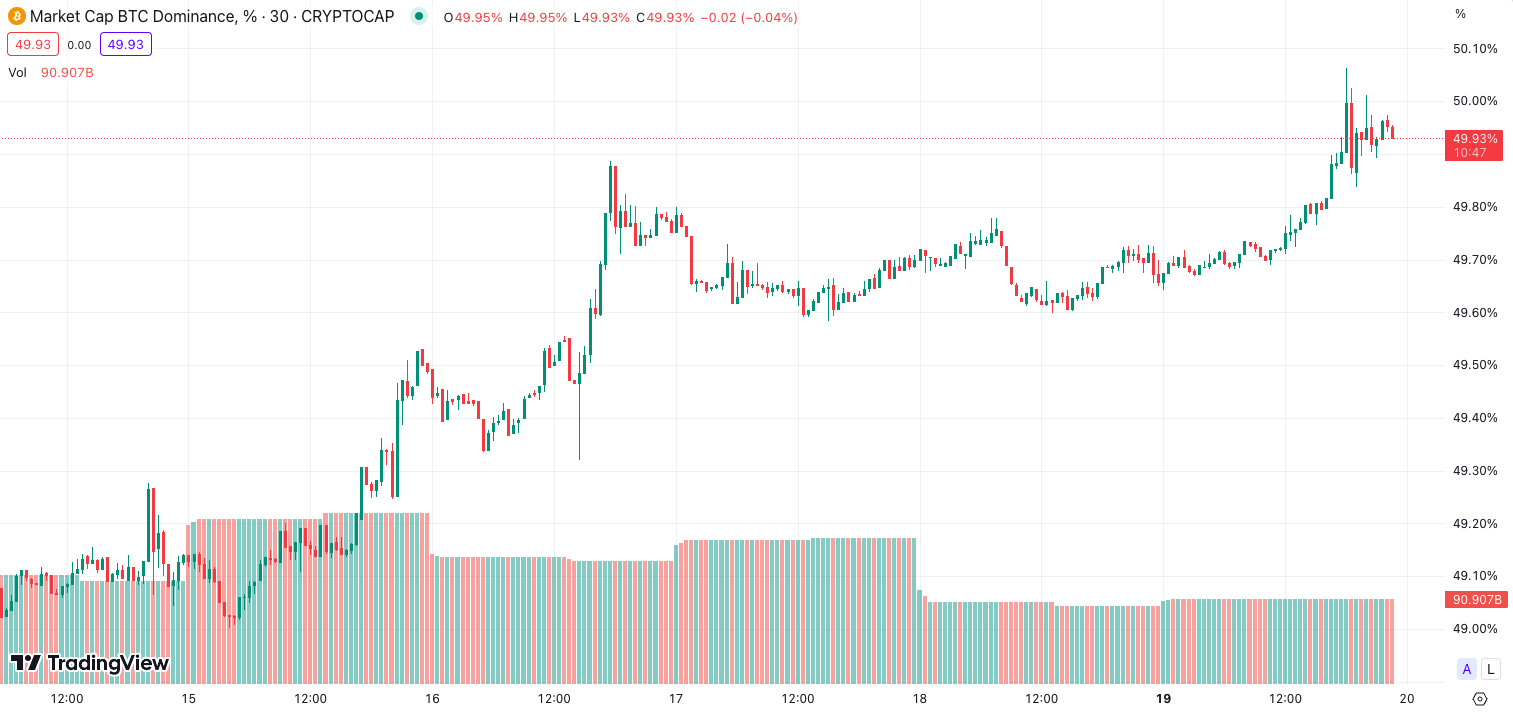
Bitcoin (BTC) dominance, the measure of how much Bitcoin makes up of the total crypto market cap, has breached the 50% mark.
On June 19 at 6 pm UTC, Bitcoin dominance hit just above 50% and has since settled to 49.9% at the time of publication, according to data from TradingView.
This means that Bitcoin alone accounts for half of crypto’s total $1.1 trillion dollar market capitalization. Bitcoin’s current market capitalization stands at $519 billion, according to data from Coingecko.
Notably, Bitcoin’s market dominance has surged by more than 10.5% since Nov. 27, 2022, an increase driven in large part by investors looking to the flagship crypto asset as a safe haven in the wake of the FTX crisis and amid mounting regulatory scrutiny of crypto assets in the United States.
While Bitcoin dominance increased significantly over the last eight months, Ether’s (ETH) market dominance has been holding steady around the 20% mark for the better part of a year. Currently, the combined value of Bitcoin and Ether now accounts for roughly 70% of the entire crypto market.
MicroStrategy co-founder and outspoken Bitcoin bull Michael Saylor believes that Bitcoin’s market dominance will top 80% in the coming years, as increasing regulatory pressure from the Securities and Exchange Commission causes stablecoins and the majority of other crypto assets to “go away.”
Regulatory clarity is going to drive #Bitcoin adoption by eliminating the confusion & anxiety that has been holding back institutional investors. Bitcoin dominance will continue to grow as the #Crypto industry rationalizes around $BTC and goes mainstream. pic.twitter.com/Foq4lpderj
— Michael Saylor⚡️ (@saylor) June 13, 2023
“The entire industry is destined to be rationalized down to a Bitcoin-focused industry, with maybe half a dozen to a dozen other Proof of Work tokens.”
Additionally, Saylor blamed the lack of any “mega institutional money” entering the crypto space on the “confusion and anxiety” brought about the by the 25,000 other cryptocurrencies that have positioned themselves as alternatives to Bitcoin.
Related: Why Cathie Wood is bullish on Coinbase stock and believes Bitcoin will reach $1 million
“Bitcoin is the universally, globally-acknowledged digital commodity in this industry,” Saylor added, making a nod to the fact that Bitcoin is the only cryptocurrency SEC Chair Gary Gensler has labeled a commodity. The SEC has now declared a total of 68 cryptocurrencies to be securities.
Bitcoin is currently changing hands for $26,746 an increase of 1.5% in the last 24 hours, according to data from Cointelegraph Price Index. The value of Bitcoin has grown more than 3% over the course of the last week despite “fear” in the crypto market reaching its highest point in three months.
Crypto research firm Santiment also points to investment colossus Blackrock’s filing for a Bitcoin spot ETF as one of the major drivers of Bitcoin’s upwards price action over the last few days.
Magazine: Bitcoin is on a collision course with ‘Net Zero’ promises
Source link

IMF’s CBDC push gets feedback from the crypto community: ‘No one wants this’

Bitcoin Price Extends Recovery But Lack of Momentum Remains A Concern

Binance’s BNB Chain introduces layer-2 testnet powered by Optimism

Why Is The Bitcoin Price Up Today?

Binance UK office one of 2,403 companies sharing ‘utility closet’ in Suffolk

Ethereum Price Indicators Suggest Strengthening Case For More Upsides

31% of young Aussies hold crypto despite being ‘risk averse’ — ASX survey

XRP Price Could Regain Strength If It Clears This Resistance

Australia’s crypto laws risk being outpaced by emerging markets: Think tank

PEPE Down 78% From May Peaks But Holder Count Rising

Bitcoin reaches 50% market dominance for first time in 2 years

UK Registration Canceled, Exits Netherlands, Cyprus

Why Cathie Wood is bullish on Coinbase stock and believes Bitcoin will reach $1 million

Is It Lights Out For Litecoin As A Daily Death Cross Approaches?

Web3 usernames may see greater adoption due to recent advancements

Judge rules LBRY video platform’s token is a security in case brought by the US SEC

Silvergate Capital’s crypto-to-fiat transfers decrease by $50B compared to Q3 2021

Will the Bitcoin mining industry collapse? Analysts explain why crisis is really opportunity

Exchange Outflows Shows Bitcoin, Ethereum Accumulation Trend Continues

Bitcoin Dropped Below 2017 All-Time-High but Could Sellers be Getting Exhausted? – Blockchain News, Opinion, TV and Jobs
BNM DAO Token Airdrop

What does the Coinbase Premium Gap Tell us about Investor Activity? – Blockchain News, Opinion, TV and Jobs
Fed policy and crumbling market sentiment could send the total crypto market cap back under $1T
New Minting Services

Can Cardano’s July hard fork prevent ADA price from plunging 60%?

SEC’s Chairman Gensler Takes Aggressive Stance on Tokens – Blockchain News, Opinion, TV and Jobs

Friends or Enemies? – Blockchain News, Opinion, TV and Jobs

LUNA2 Recovers 70% In Nine Days From Historic Lows

Enjoy frictionless crypto purchases with Apple Pay and Google Pay | by Jim | @blockchain | Jun, 2022
A String of 200 ‘Sleeping Bitcoins’ From 2010 Worth $4.27 Million Moved on Friday
-
 SEC7 months ago
Judge rules LBRY video platform’s token is a security in case brought by the US SEC
-
 Banking8 months ago
Silvergate Capital’s crypto-to-fiat transfers decrease by $50B compared to Q3 2021
-
 Antminer11 months ago
Will the Bitcoin mining industry collapse? Analysts explain why crisis is really opportunity
-
 Bitcoin8 months ago
Exchange Outflows Shows Bitcoin, Ethereum Accumulation Trend Continues
-
 Altcoins12 months ago
Bitcoin Dropped Below 2017 All-Time-High but Could Sellers be Getting Exhausted? – Blockchain News, Opinion, TV and Jobs
-
Uncategorized1 year ago
BNM DAO Token Airdrop
-
 Binance11 months ago
What does the Coinbase Premium Gap Tell us about Investor Activity? – Blockchain News, Opinion, TV and Jobs
-
 Asia11 months ago
Fed policy and crumbling market sentiment could send the total crypto market cap back under $1T