
Binance Coin
Bitcoin price eyes $26K ‘acceleration’ zone as Binance fears fade

Bitcoin headed toward a “crucial area” after the June 16 Wall Street open, as a recovery from three-month lows continued.
Bitcoin reinforces rebound from multi-month lows
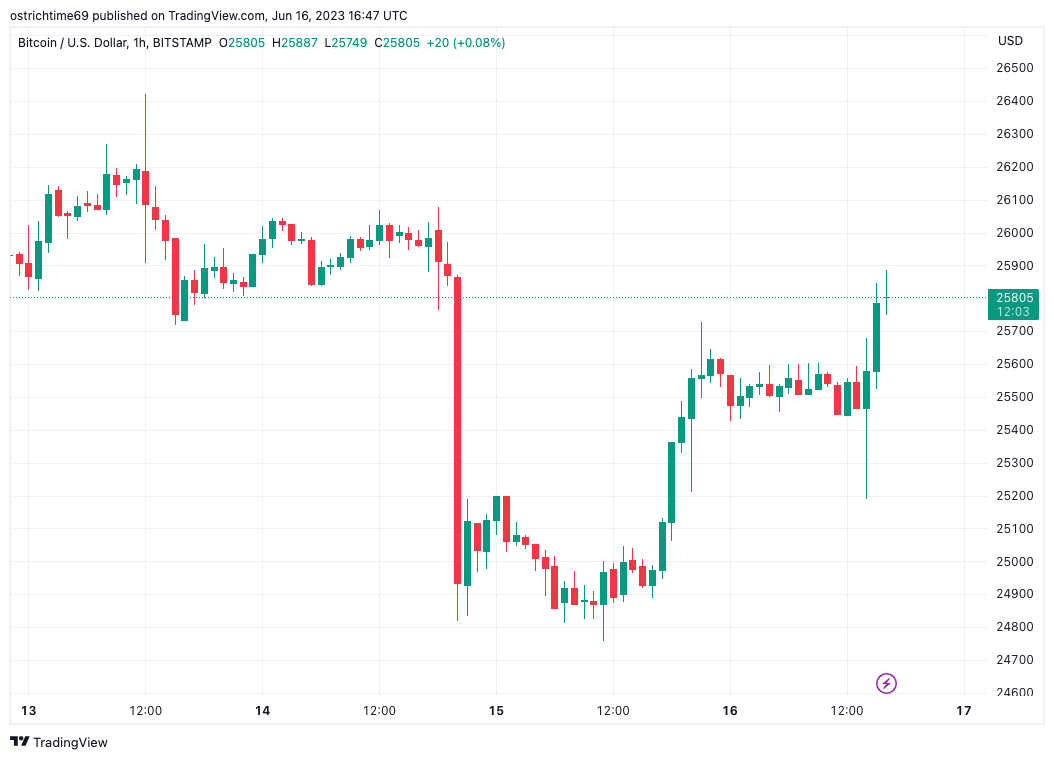
Data from Cointelegraph Markets Pro and TradingView showed BTC/USD nearing $26,000 on Bitstamp.
The Bitcoin (BTC) price built on an overnight rebound from its lowest levels since early March amid ongoing regulatory and macroeconomic pressures.
For Michaël van de Poppe, founder and CEO of trading firm Eight, $26,000 represented a key level for bulls to flip next.
“Long weekend is coming up with the bank holiday on Monday,” he told Twitter followers, referencing the Juneteenth holiday in the United States.
“For Bitcoin, crucial area to break is $26K. If that breaks, we’ll have some acceleration. I’m still long, would still long if we reach $24.4K too.”
That $24,400 downside area of interest was already in focus for various popular traders.
Among them was Daan Crypto Trades, who predicted a return closer to $26,000 as part of a narrowing wedge structure in place on lower timeframes.
#Bitcoin Low timeframe:
Struggling to break the Weekly VWAP so far.
You can clearly see how it’s rejecting price every time we’ve touched it.
A break above, should lead to a next leg into the May lows around 25.8-25.9K.
Support sits at $25.3K. pic.twitter.com/kIjeRdaMiN
— Daan Crypto Trades (@DaanCrypto) June 16, 2023
“This dip into $24,000 is a great opportunity,” fellow trader Jelle wrote in part of the day’s tweets, adding that the Twitter user was “ready for the bull market.”
My game plan remains unchanged.
I started buying around $16,500, and so long as we trade below $30,000 - I will continue to buy on pullbacks.
This dip into $24,000 is a great opportunity.
Bought more #Bitcoin - ready for the bull market. pic.twitter.com/R78ZUu7SPI
— Jelle (@CryptoJelleNL) June 16, 2023
Market joins Binance CEO in dismissing France “FUD”
June 16, meanwhile, marked another test for major exchange Binance, with France launching investigative proceedings hours after an announcement that Binance would quit the Netherlands altogether over regulatory difficulties.
Related: 3 Bitcoin price metrics showing ‘insane’ similarities to 2020 breakout
Markets appeared immune to the news, however, and in characteristic fashion, Binance CEO Changpeng Zhao, known as CZ, called the France episode “FUD” — fear, uncertainty and doubt.
“France, surprise (no advanced notice) on-site inspections of regulated businesses are the norm, for banks, and now for crypto too. The surprise visit for Binance France happened a couple of weeks ago. It’s not ‘news.’ Binance France cooperated fully,” he tweeted on the day.
“Binance also isn’t the only crypto business inspected. This happened to other well known crypto businesses in Paris too. Binance France continues to be our flagship center in Europe.”
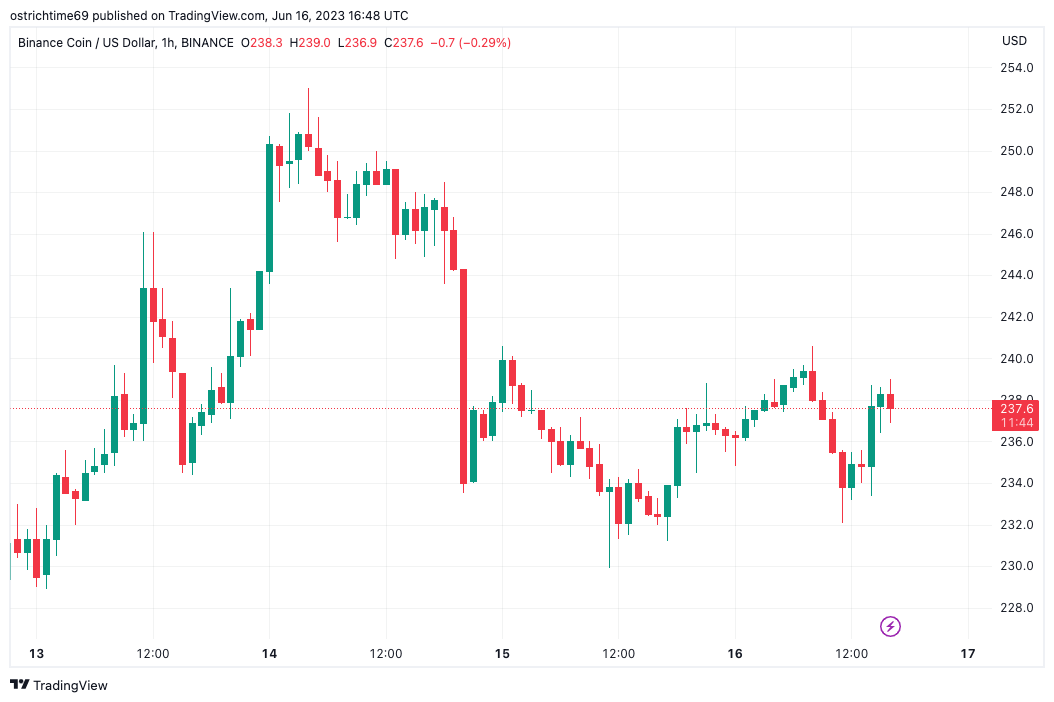
Binance’s in-house token, BNB (BNB), appeared similarly resilient, climbing to $240 on the day.
Magazine: Bitcoin is on a collision course with ‘Net Zero’ promises
This article does not contain investment advice or recommendations. Every investment and trading move involves risk, and readers should conduct their own research when making a decision.
Source link


Binance Coin (BNB), the native token of the Binance ecosystem, has faced significant challenges in the wake of the recent lawsuits filed by the US Securities and Exchange Commission (SEC) against both crypto exchange Binance and Coinbase.
These regulatory actions have had a profound impact on the cryptocurrency market, stifling any potential upward momentum. As a result, Bitcoin (BTC) retested its lowest point in two months, plummeting to $24,000 at the time of the filing.
While BNB also endured the repercussions of the regulatory pressure, it managed to find some stability around the $220 support level.
How will Binance Coin navigate the tough US regulations and maintain its position within the cryptocurrency landscape?
Challenges For BNB’s Upside Potential
In the latest report on BNB price, a Fibonacci retracement tool has been employed based on the price action observed in the second quarter of 2023. This tool reveals two significant obstacles that could impede BNB’s upward trajectory.
The first obstacle lies at the 23.6% Fibonacci level, marked at $250.8, while the second hurdle resides at the 38.2% Fibonacci level, indicated by $269.8. Should BNB encounter a price denial at these resistance levels, it is likely to experience a retracement, possibly revisiting the $220 support level.
BNB market cap currently at $37.9 billion on the daily chart: TradingView.com
Prone To Aggressive Sell-Off Upon Breaching Strong Support
If BNB manages to surpass the mentioned bullish threshold, there is a possibility of it facing a significant downturn in the form of an aggressive sell-off. In this particular scenario, it would be prudent to keep an eye on the immediate lower support levels at $200 and $184.
These levels hold significance as they could potentially serve as crucial points where the price of BNB may find temporary stability or experience further downward pressure.

Source: Coingecko
At CoinGecko, the current price of BNB stands at $243, reflecting a slight decline of 0.9% over the past 24 hours; however, it has experienced a notable seven-day rally of 8.6%.
Meanwhile, since the SEC sued Binance, open interest (OI) rates for BNB have gradually increased. The OI has increased from $316 million on June 5 to the current level of $385 million. The rising number of open contracts for BNB on the futures market indicates an optimistic outlook.
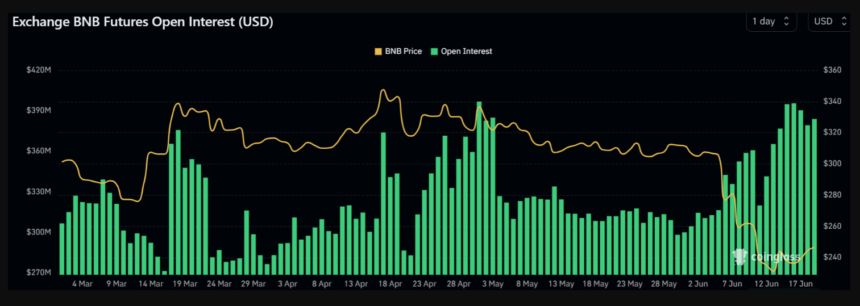
Source: Coinglass
With Binance Coin currently facing significant hurdles at key levels, the outcome of this price analysis raises the question of whether BNB will manage to overcome these obstacles and regain its upward momentum.
Traders and investors will be closely monitoring the price rejection scenario, the strength of support levels, and the buying pressure indicators to assess BNB’s future performance in the crypto market.
(This site’s content should not be construed as investment advice. Investing involves risk. When you invest, your capital is subject to risk).
Featured image from Currency.com
Source link

BNB price (Binance coin) is recovering above $240 against the US Dollar. The price might gain bullish momentum if it clears $260 and $270.
- Binance coin price is attempting a recovery wave above $240 against the US Dollar.
- The price is now trading below $260 and the 100 simple moving average (4 hours).
- There is a key bullish trend line forming with support near $242 on the 4-hour chart of the BNB/USD pair (data source from Binance).
- The pair might struggle to gain bullish momentum above $260 and $270.
Binance Coin Price Faces Resistance
In the past few days, BNB price saw a major decline below the $260 support. There was a move below the $250 support zone, sparking bearish moves in Bitcoin and Ethereum.
The price even dived toward the $220 support. A low is formed near $220.6 and the price is now attempting a recovery wave. There was a move above the $240 resistance. The price climbed above the 23.6% Fib retracement level of the key decline from the $317.0 swing high to the $220.6 low.
The price is now consolidating below $260 and the 100 simple moving average (4 hours). There is also a key bullish trend line forming with support near $242 on the 4-hour chart of the BNB/USD pair.
On the upside, BNB is facing resistance near the $254 level. The next major resistance is near $260 and the 100 simple moving average (4 hours). The main resistance is now forming near $268 and the 50% Fib retracement level of the key decline from the $317.0 swing high to the $220.6 low.
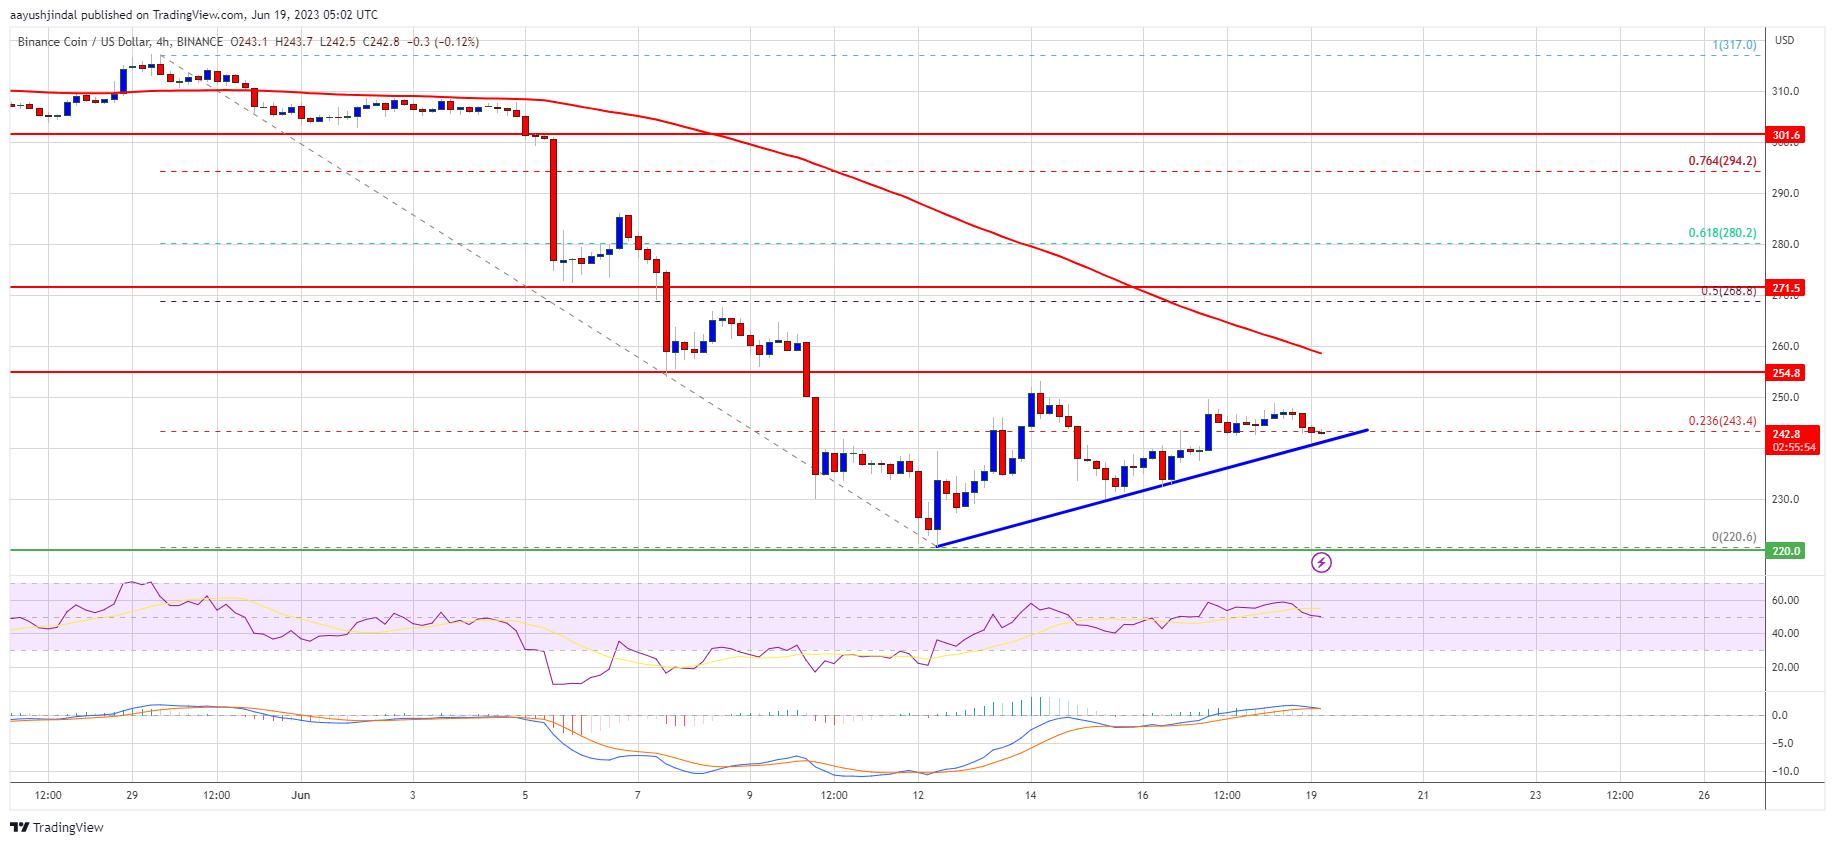
Source: BNBUSD on TradingView.com
A clear move above the $260 resistance and $268 might start a steady increase. The next major resistance is near the $280 level, above which the price might rise toward the $300 resistance.
Fresh Decline in BNB?
If BNB fails to clear the $260 resistance, it could start another decline. Initial support on the downside is near the $242 level and the trend line.
The next major support is near the $230 level. If there is a downside break below the $230 support, the price could revisit the $220 support. Any more losses could send the price toward the $200 support.
Technical Indicators
4-Hours MACD – The MACD for BNB/USD is losing pace in the bullish zone.
4-Hours RSI (Relative Strength Index) – The RSI for BNB/USD is currently above the 50 level.
Major Support Levels – $242, $230, and $220.
Major Resistance Levels – $260, $268, and $270.
Source link
The bears lost an opportunity when they failed to sustain Bitcoin (BTC) below the $25,000 level this week. That may have attracted buying from the bulls who are attempting to start a recovery in Bitcoin and select altcoins.
Additionally, BlackRock’s application to launch a Bitcoin spot price exchange-traded fund and the sustained strength in the United States equities markets may have helped improve crypto sentiment. Bitcoin is on track to finish the week with a minor gain of 2% and institutional buying in the Grayscale Bitcoin Trust reduced its discount to Bitcoin spot from 44% on June 13 to 36.6%, according to CoinGlass data.
Although Bitcoin and select altcoins are trying to start a relief rally, the overall trend remains bearish. Therefore, short-term traders who buy for a pullback should consider booking profits or tightening their stops when the price struggles to break above stiff resistance levels.
The strategy may be different for long-term investors who may use the dips to strong support levels to acquire the cryptocurrencies of their choice. It is prudent to adopt a staggered buying approach as a runaway rally is unlikely.
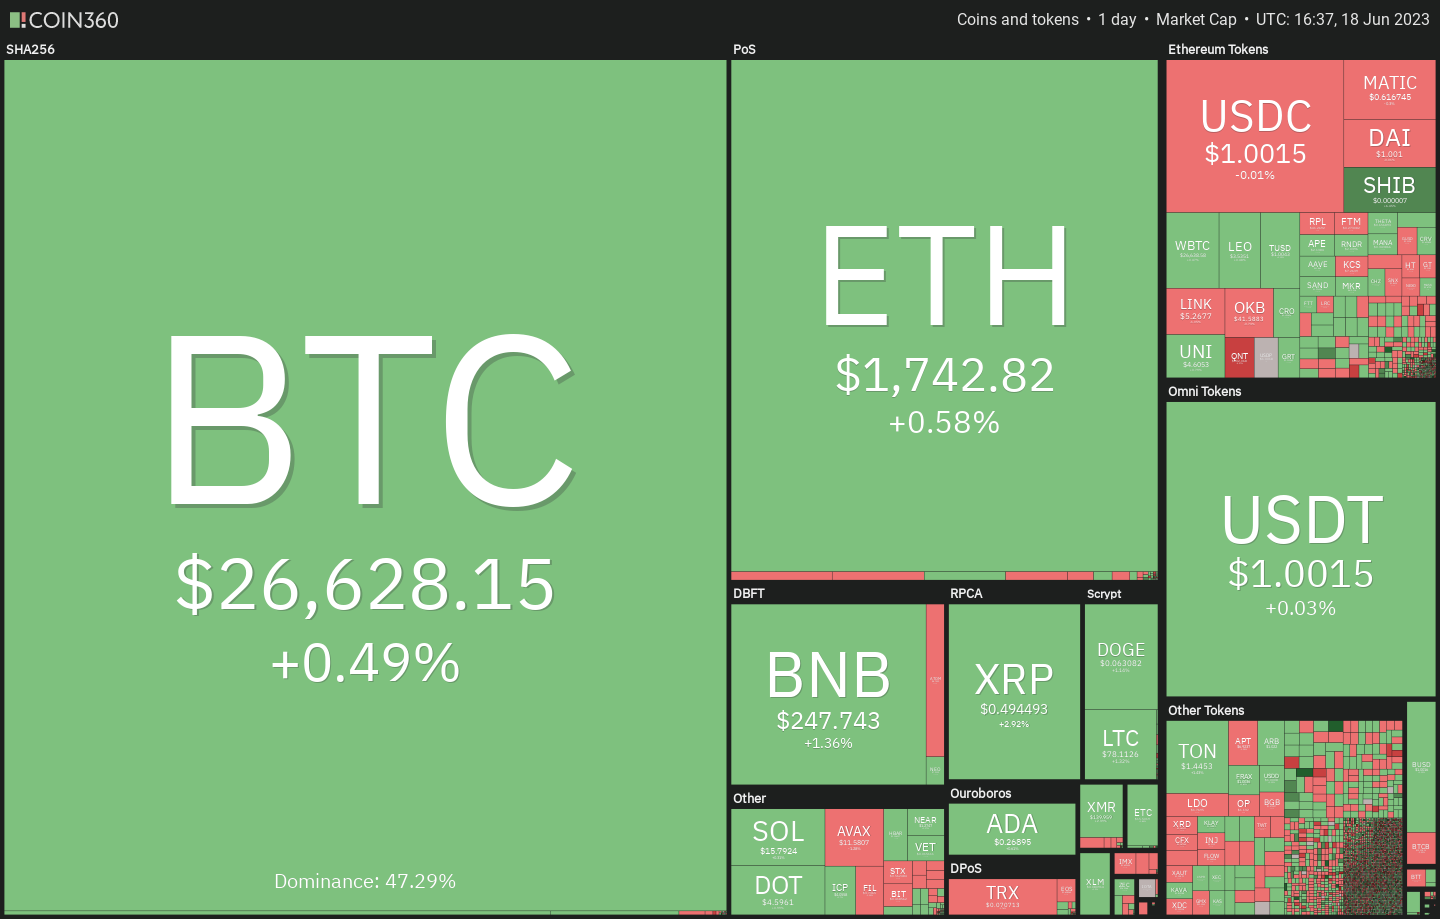
Let’s look at the top-5 cryptocurrencies that are trying to start a recovery in the short term.
Bitcoin price analysis
Bitcoin turned up sharply on June 15, trapping the aggressive bears who may have gone short on a break below $25,250. That may have caused a short squeeze in the near term, which propelled the price to the 20-day exponential moving average ($26,403).
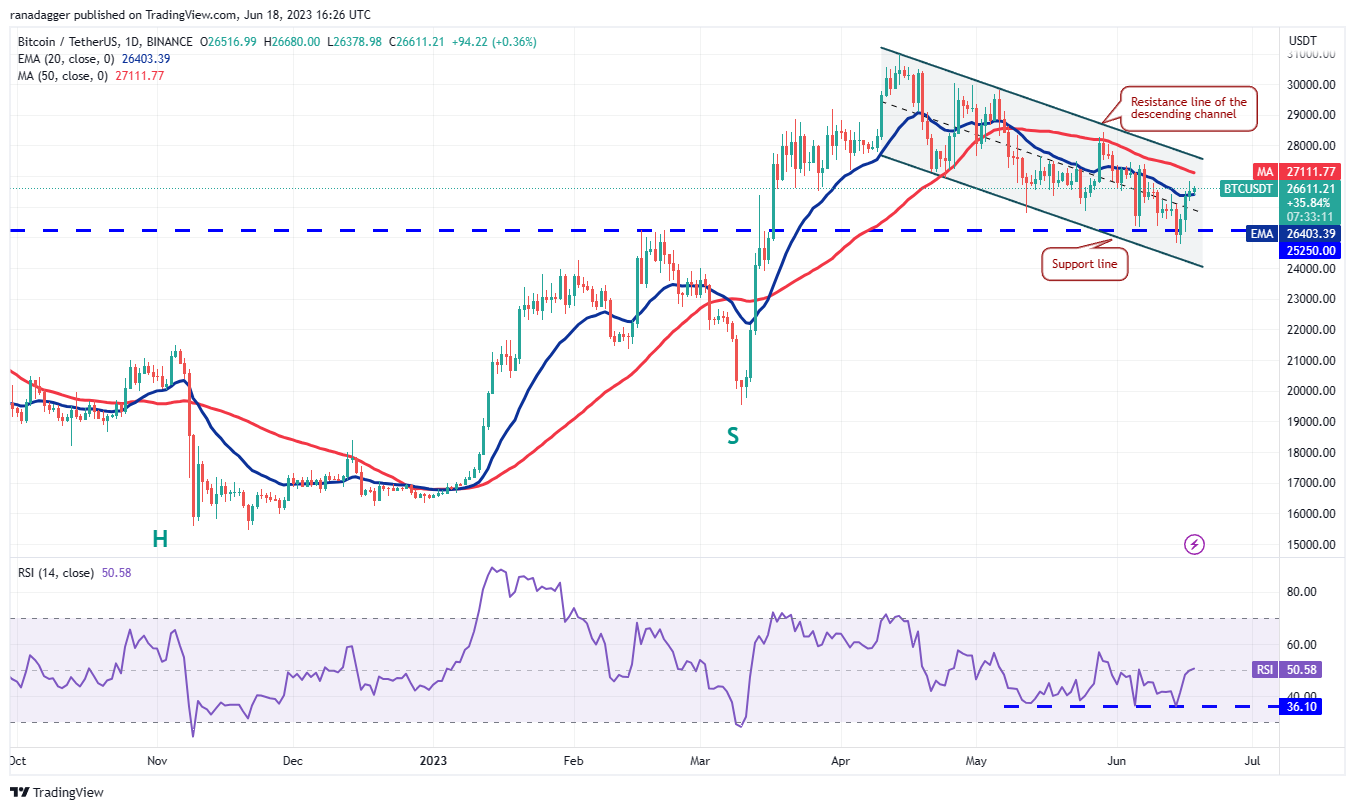
The bears are trying to limit the relief rally at the 20-day EMA but a positive sign is that the bulls have not given up much ground. This suggests that the buyers are holding on to their positions in anticipation of a move higher.
However, the bears are likely to have other plans as they will try to offer stiff resistance in the zone between the 20-day EMA and the resistance line of the descending channel. If the price turns down from this zone, the BTC/USDT pair may remain inside the channel for a while longer.
But if bulls drive the price above the channel, the pair will signal a potential trend change in the near term. The pair could then surge toward $31,000.
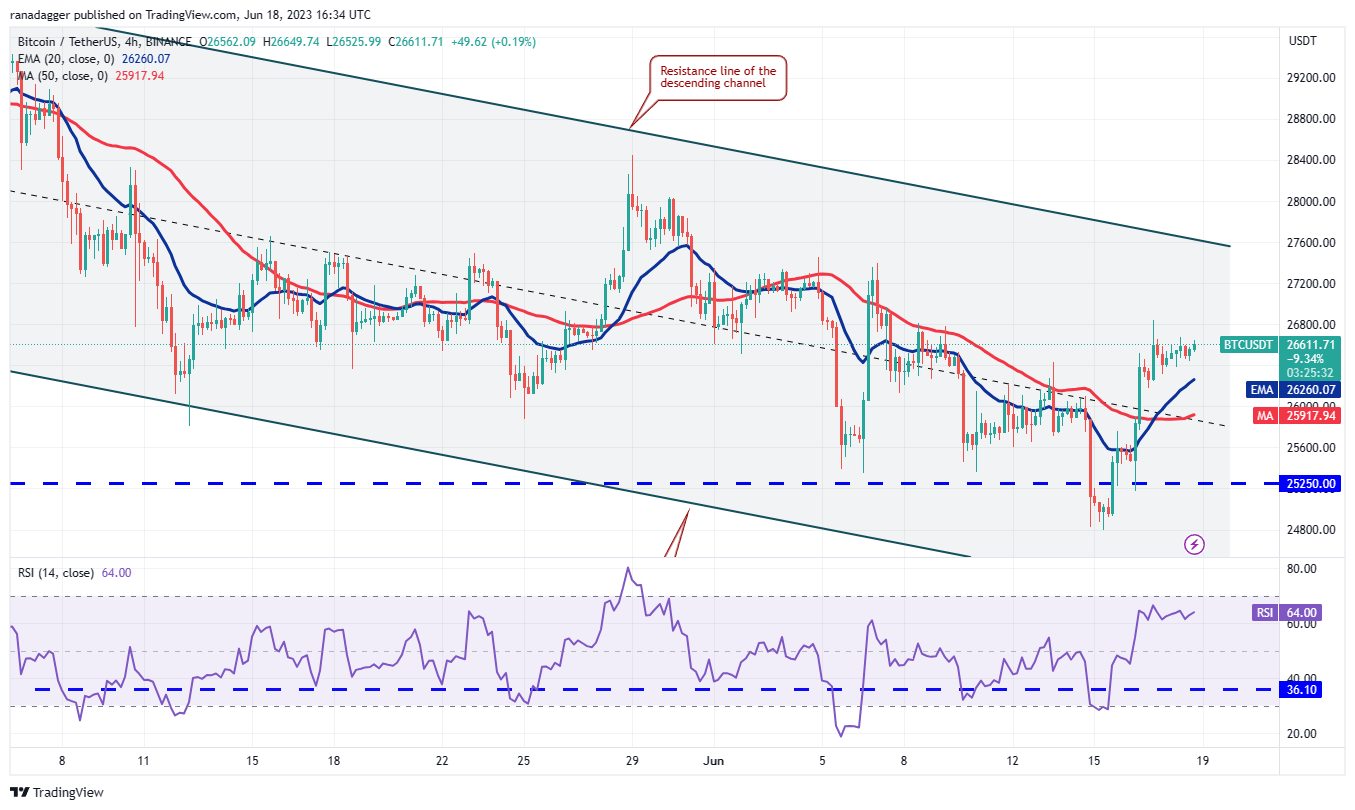
The 20-EMA on the 4-hour chart has turned up and the relative strength index (RSI) is in the positive area, indicating that bulls have the upper hand in the near term. There is a minor resistance at $26,850 but if that is crossed, the pair may reach the resistance line of the channel near $27,600. This level may prove to be a difficult hurdle for the bulls to cross but if they manage to do that, the pair could rally to $28,500.
This positive view will invalidate in the short term if the price turns down and breaks below the 20-EMA. That could pull the price down to the 50-simple moving average and eventually to the strong support zone between $25,250 and $24,800. A break below this zone may intensify selling.
BNB price analysis
BNB (BNB) has been in the thick of things for the past few days but a positive sign is that the bulls did not allow the price to break the $220 support. This indicates demands at lower levels.
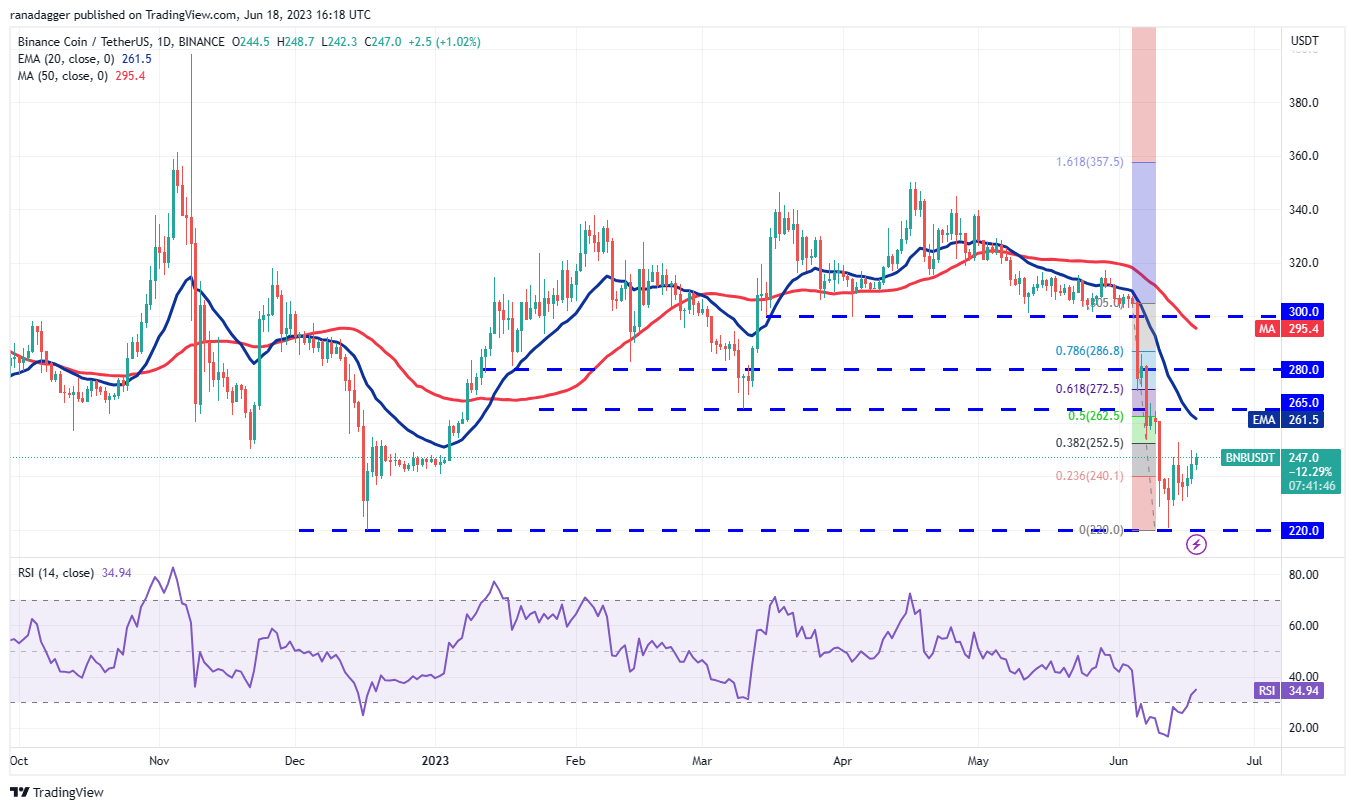
The first resistance on the upside is the 38.2% Fibonacci retracement level of $252.50. If this level is scaled, the BNB/USDT pair may reach the 20-day EMA ($261). The bears will try to halt the recovery at this level. If they succeed, the pair may turn down toward $220.
On the contrary, if bulls propel the price above the 20-day EMA, the pair could reach the 61.8% Fibonacci retracement level of $272.50. This is a crucial level for the bears to defend because if it gives way, the pair may soar toward $305.
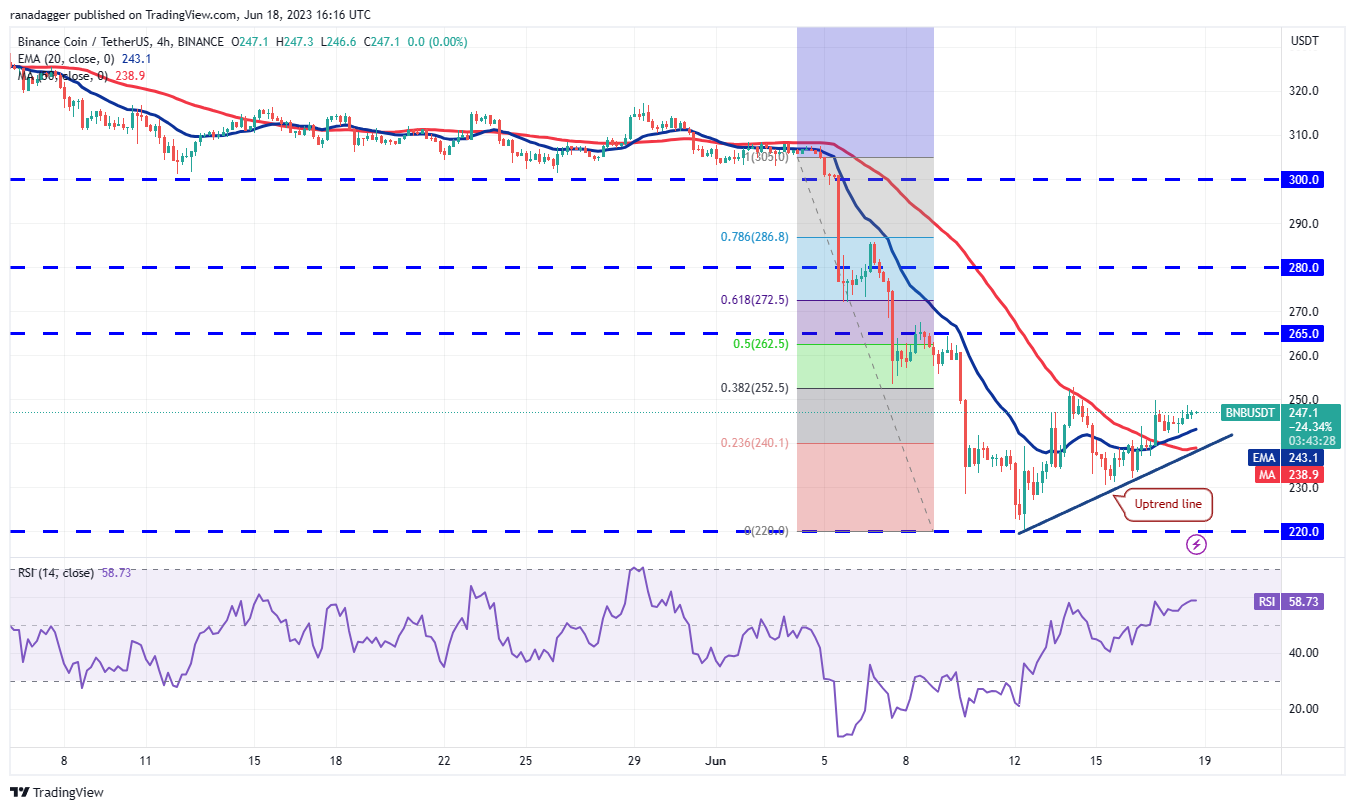
The 4-hour chart shows that the moving averages have completed a bullish crossover and the RSI has risen into the positive zone. This indicates that buyers are attempting a comeback. The bulls will have to overcome the barrier at $252.50 to gain strength. The pair could then rally to $265.
On the downside, the first support is at the 20-EMA. If this level breaks down, the pair could slip to the uptrend line. A break and close below this level will indicate that the bulls have given up. The pair could then retest the critical support at $220.
Litecoin price analysis
Litecoin (LTC) plunged below the symmetrical triangle pattern on June 10, indicating that bears have the upper hand. The sellers pulled the price below the immediate support at $75 on June 14 but could not build upon this move.
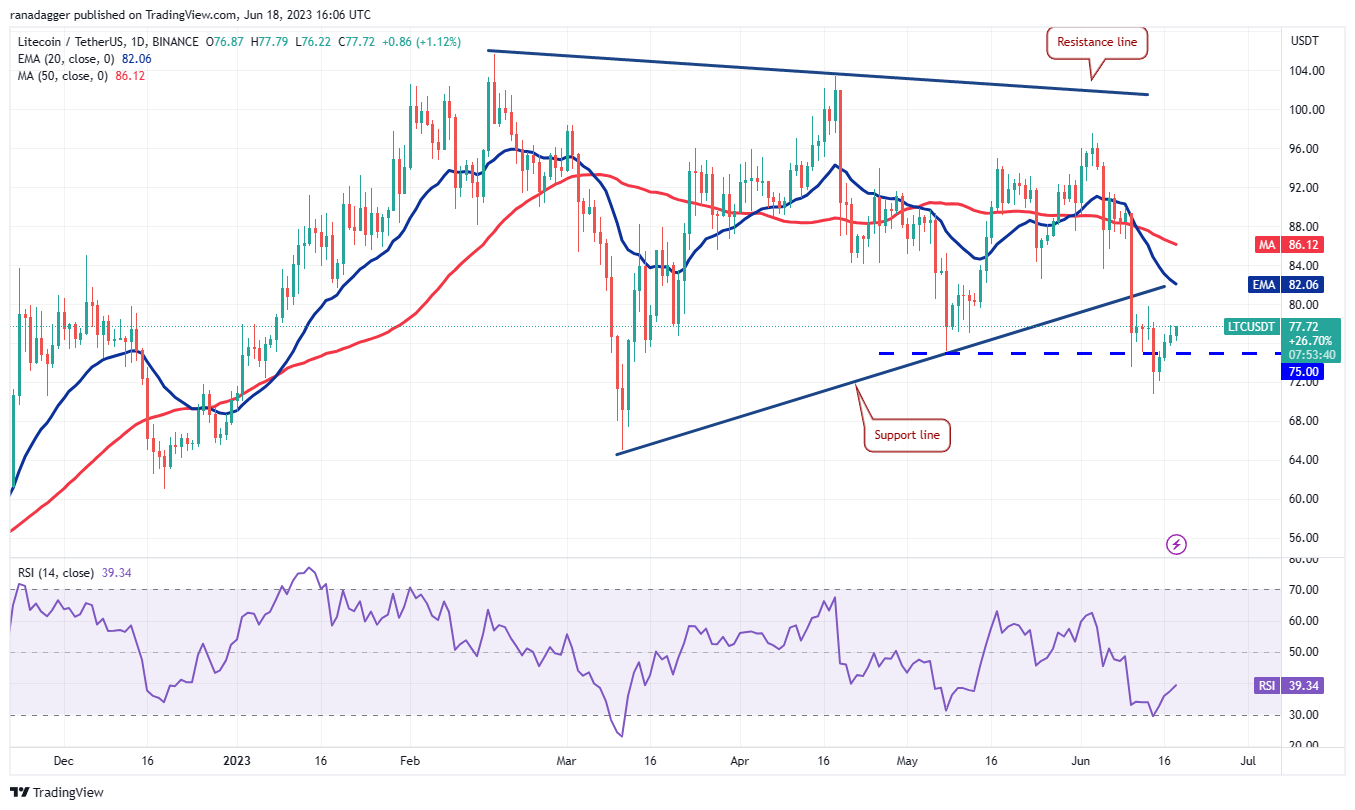
The sharp recovery in the past few days has pushed the LTC/USDT pair back above $75. This shows strong buying at lower levels. The bulls will next try to push the price to the 20-day EMA ($82), which is an important level to keep an eye on. If buyers clear this hurdle, the pair may rise to the 50-day SMA ($86).
Contrary to this assumption, if the price turns down from the current level or the 20-day EMA and breaks below $70, it will signal the start of the downtrend. The first stop is likely to be $65 and then $60.
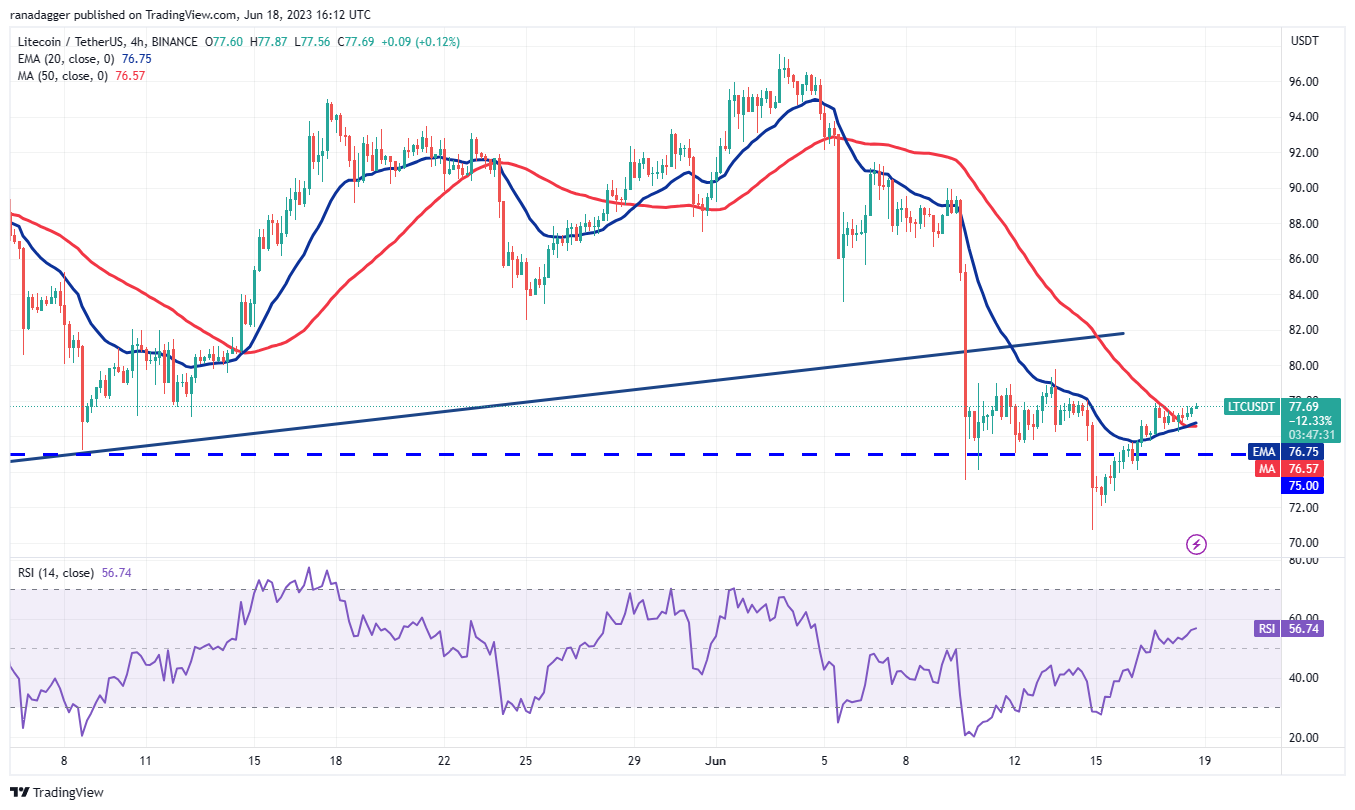
The strong recovery pushed the price above the 20-EMA on the 4-hour chart, suggesting that the selling pressure is reducing. The moving averages are on the verge of completing a bullish crossover and the RSI has jumped into the positive territory, indicating that buyers are attempting a comeback.
There is a minor resistance at $80 but if bulls overcome this obstacle, the pair may accelerate to $85 and thereafter to $90. If bears want to prevent the up-move, they will have to quickly yank the price back below $75.
Related: Binance sends cease and desist notice to fraudulent Nigerian entity
OKB price analysis
OKB (OKB) broke below the symmetrical triangle pattern on June 10, signaling the start of a deeper correction. A minor positive for the bulls is that they successfully defended the support at $30.50, indicating demand at lower levels.
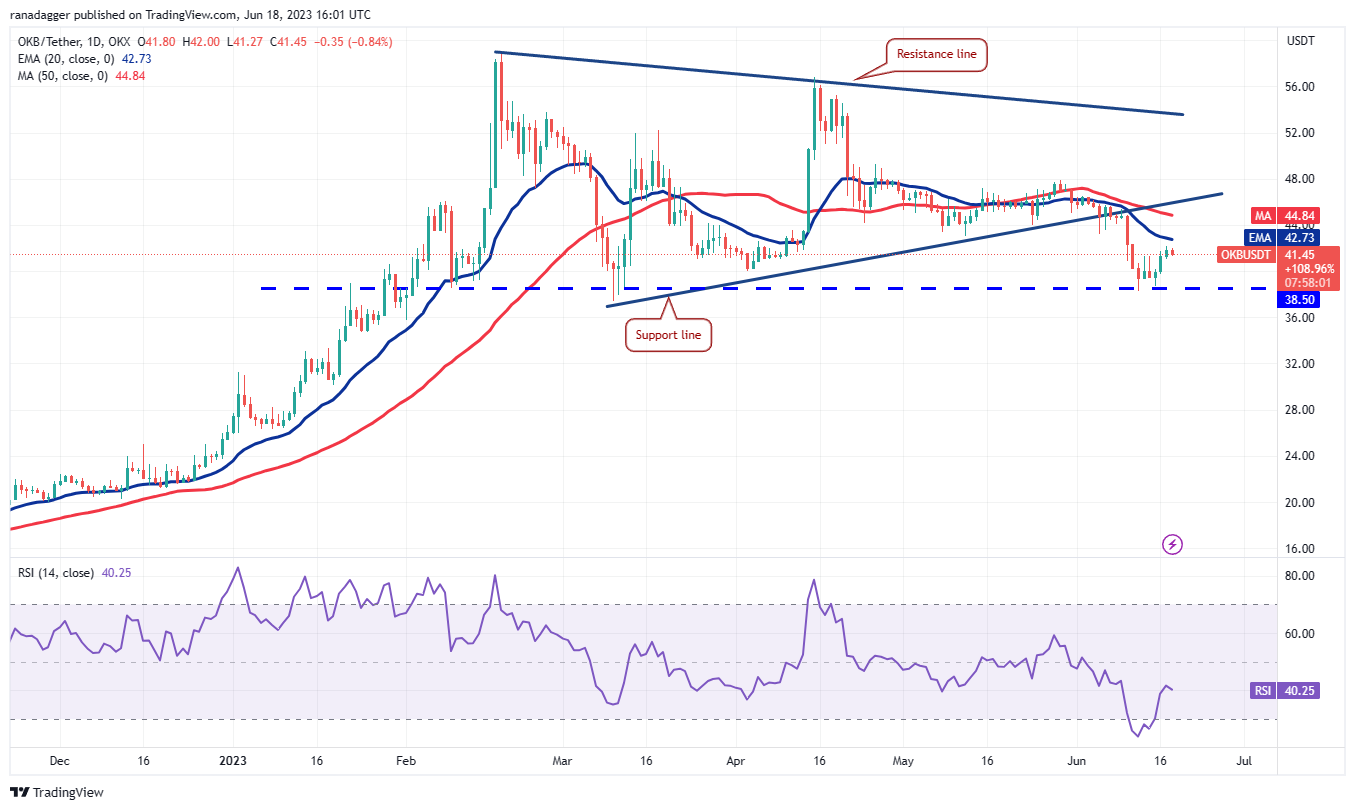
The price has reached the 20-day EMA ($42.73), which is an important level to watch out for. If the price turns down from the current level, it will suggest that the sentiment remains negative and traders are selling on rallies. That could pose a serious threat to the $38.50 support. If this level gives way, the OKB/USDT pair may skid to $35 and eventually to $30.
Contrarily, if buyers thrust the price above the 20-day EMA, it will suggest that the bears may be losing their grip. The pair could then rise to the support line, which is likely to act as a formidable resistance. Buyers will have to kick the price above $48 to gain the upper hand.
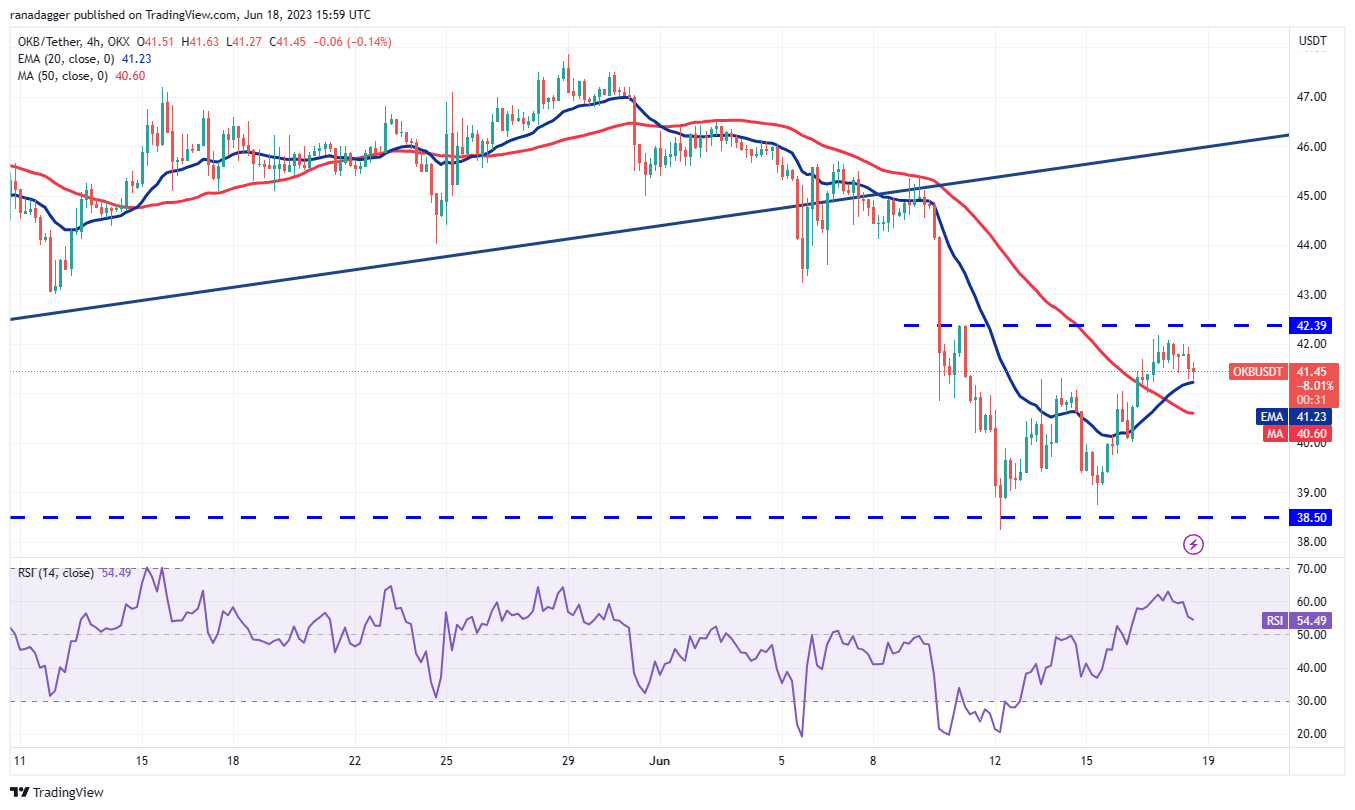
The pair bounced off $38.50 with vigor but is facing resistance near $42.39. A minor positive in favor of the buyers is that the moving averages have completed a bullish crossover and the RSI is in the positive territory.
If buyers thrust the price above $42.39, the pair may pick up momentum and soar to $46 where the bears are again expected to mount a strong defense.
Another possibility is that the price turns down and tumbles below the 20-EMA. That may indicate a possible range-bound action between $38.50 and $42.39 for some time.
Quant price analysis
Quant (QNT) rebounded off the $95 level with strength on June 16, indicating aggressive buying at the support.
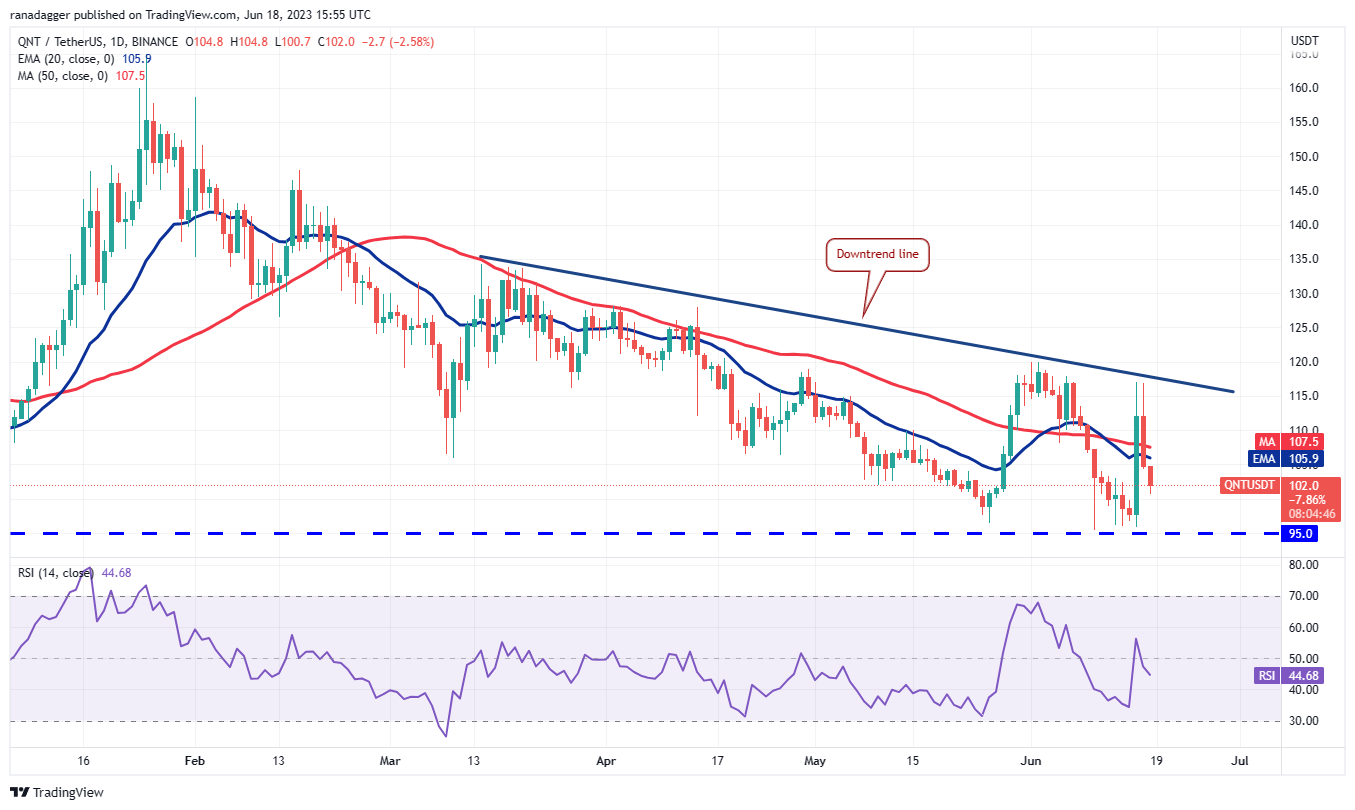
However, the bears have not yet given up and they are fiercely defending the downtrend line. Sellers will try to sink the price below $95 while the bulls will try to maintain the QNT/USDT pair above it.
If the price turns up from $95 once again, it will enhance the prospects of a rally above the downtrend line. If that happens, the pair may start a strong recovery that could catapult the price to $135.
This positive view could invalidate in the near term if the price continues lower and plummets below $95. The pair may then slip to $87 and subsequently to $80.
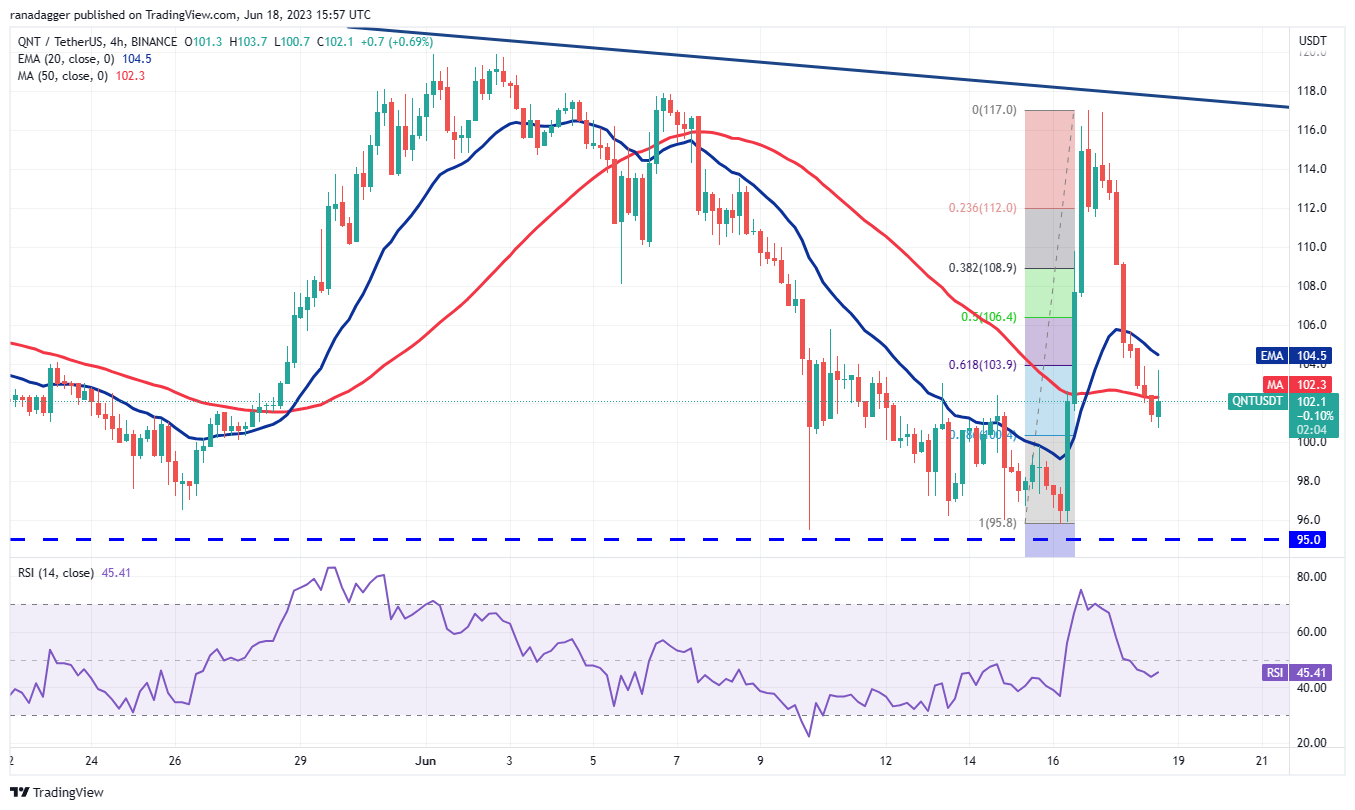
The 4-hour chart shows that the pair quickly gave back a major portion of its gains, indicating that bears are active at higher levels. They pulled the price below the 61.8% Fibonacci retracement level of $103.90, which is a negative sign.
Buyers will have to quickly drive the price back above the moving averages if they want to have another shot at the downtrend line. Alternatively, if the price sustains below the 50-SMA, the likelihood of a drop to $95 increases.
This article does not contain investment advice or recommendations. Every investment and trading move involves risk, and readers should conduct their own research when making a decision.
This article is for general information purposes and is not intended to be and should not be taken as legal or investment advice. The views, thoughts, and opinions expressed here are the author’s alone and do not necessarily reflect or represent the views and opinions of Cointelegraph.
Source link

UK government moves forward on financial markets bill for potential regulation of crypto

Sentenced To 4 Months In Montenegrin Jail

Realtor may have accepted $3M offer for Washington, DC property linked to Sam Bankman-Fried

Stablecoins Supply Finally Shows Rise, Here’s Why This Is Bullish For Bitcoin

Do Kwon gets 4 months in prison in Montenegro on fake passport charges

TWT Tallies 30% In Last Week, Will It Test $1 Mark?

Kenny Schachter reflects on blockchain art’s past, present and future

ZachXBT Legal Fight Turns Into Funding Success

Binance cancels registration in the UK amid regulatory scrutiny

PEPE Sustains Steady Ascent, Fueling Speculation of Profits

‘Britcoin’ launch inches closer after Project Rosalind CBDC tests

Binance Coin Defies Regulatory Pressure, Holds $220 Support

Do Kwon denies forging passport, blames ‘Chinese’ agency: Report

Fresh Increase Possible Above 100 SMA

Coinbase blasts SEC for ‘no straight answers’ following court order

Judge rules LBRY video platform’s token is a security in case brought by the US SEC

Silvergate Capital’s crypto-to-fiat transfers decrease by $50B compared to Q3 2021

Will the Bitcoin mining industry collapse? Analysts explain why crisis is really opportunity

Exchange Outflows Shows Bitcoin, Ethereum Accumulation Trend Continues

Bitcoin Dropped Below 2017 All-Time-High but Could Sellers be Getting Exhausted? – Blockchain News, Opinion, TV and Jobs
BNM DAO Token Airdrop

What does the Coinbase Premium Gap Tell us about Investor Activity? – Blockchain News, Opinion, TV and Jobs
Fed policy and crumbling market sentiment could send the total crypto market cap back under $1T
New Minting Services

Can Cardano’s July hard fork prevent ADA price from plunging 60%?

SEC’s Chairman Gensler Takes Aggressive Stance on Tokens – Blockchain News, Opinion, TV and Jobs

Friends or Enemies? – Blockchain News, Opinion, TV and Jobs

LUNA2 Recovers 70% In Nine Days From Historic Lows

Enjoy frictionless crypto purchases with Apple Pay and Google Pay | by Jim | @blockchain | Jun, 2022
A String of 200 ‘Sleeping Bitcoins’ From 2010 Worth $4.27 Million Moved on Friday
-
 SEC7 months ago
Judge rules LBRY video platform’s token is a security in case brought by the US SEC
-
 Banking8 months ago
Silvergate Capital’s crypto-to-fiat transfers decrease by $50B compared to Q3 2021
-
 Antminer11 months ago
Will the Bitcoin mining industry collapse? Analysts explain why crisis is really opportunity
-
 Bitcoin8 months ago
Exchange Outflows Shows Bitcoin, Ethereum Accumulation Trend Continues
-
 Altcoins12 months ago
Bitcoin Dropped Below 2017 All-Time-High but Could Sellers be Getting Exhausted? – Blockchain News, Opinion, TV and Jobs
-
Uncategorized1 year ago
BNM DAO Token Airdrop
-
 Binance11 months ago
What does the Coinbase Premium Gap Tell us about Investor Activity? – Blockchain News, Opinion, TV and Jobs
-
 Asia11 months ago
Fed policy and crumbling market sentiment could send the total crypto market cap back under $1T