
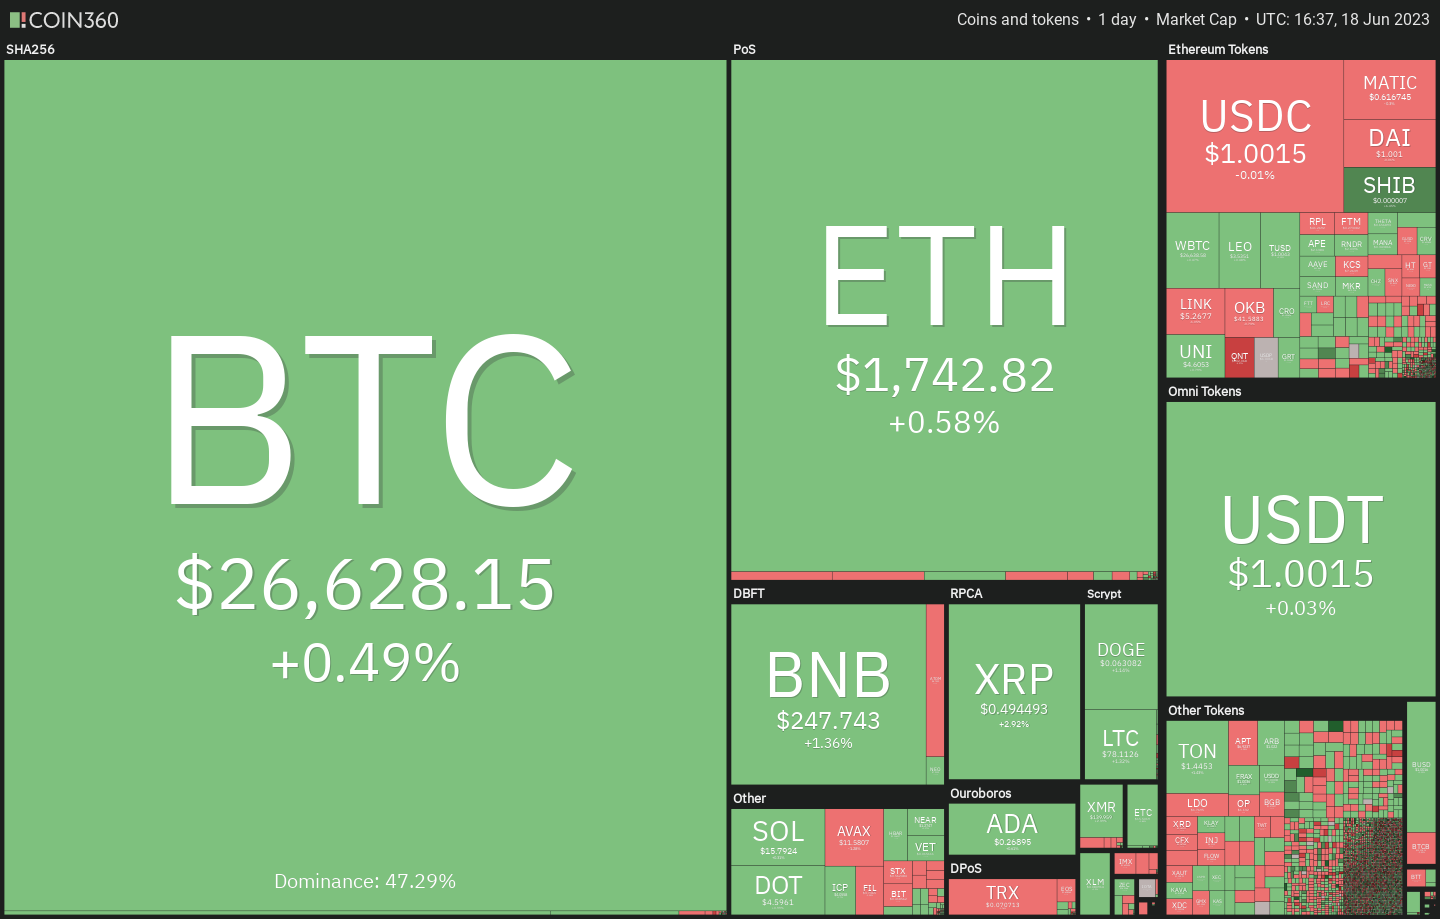
Bitcoin
What Happens To Bitcoin Price If Spot ETF Is Approved?

The application by BlackRock, the world’s largest asset manager, for approval of a Bitcoin spot ETF with the US Securities and Exchange Commission (SEC) is the biggest story in the crypto market today. Numerous experts are extremely optimistic that an approval of the first Bitcoin spot ETF in the US will be a massively bullish event, attracting huge amounts of new capital and triggering a new bull run.
But where does this theory come from? Bitcoin is often referred to as the digital gold of the 21st century, so it’s an obvious choice to look at the history of gold and the first gold based spot ETF.
Why The BlackRock Bitcoin ETF Would Be So Bullish
The first thing to note is that BlackRock applied for a spot ETF and not a Futures ETF. The SEC has already approved a number of Bitcoin Futures ETFs that hold Bitcoin futures contracts on the CME. These are currently traded on the US equity markets, but have relatively low popularity. And this has its reasons, first and foremost the so-called “drag”, as Scimitar Capital explains.
Drag refers to the underperformance of a fund that attempts to replicate the return of a particular underlying asset and is a long-term result of regular portfolio rebalancing. To track the spot price, BITO, the largest bitcoin futures ETF, holds 2/3 in the front-month future and 1/3 in the following month.
However, this “rolling” is costly because of transaction fees, slippage and because futures for the last month are usually traded at a premium over the first month in BTC (“contango”). For this reason, futures ETFs are not a good investment for retail traders in the long run and are therefore unpopular.
A Bitcoin spot ETF does not have these disadvantages. “This is the reason why physically backed ETFs like GLD and IAU for gold have a combined 90B of AUM whereas futures backed ones like BITO and USO have a paltry 1.6B,” Scimitar Capital says.
The first gold ETF, the SPDR Gold Trust ETF (GLD), was listed on the NYSE on November 15, 2004 and revolutionized gold trading. Before GLD came on the market, it was possible to invest in gold in the form of bars, coins, certificates and shares of gold mining companies.
The exchange-traded fund made investing in precious metals a no-brainer and eliminated the problems of shipping and vaults. The same revolution could be coming to Bitcoin by a Bitcoin spot ETF. Retail investors could hold Bitcoin long-term through the ETF without worrying about custody and private keys.
And the revolution in gold also made itself felt in the price. While the price of gold was still below $450 per ounce in November 2004, gold saw a meteoric rise in the years that followed.
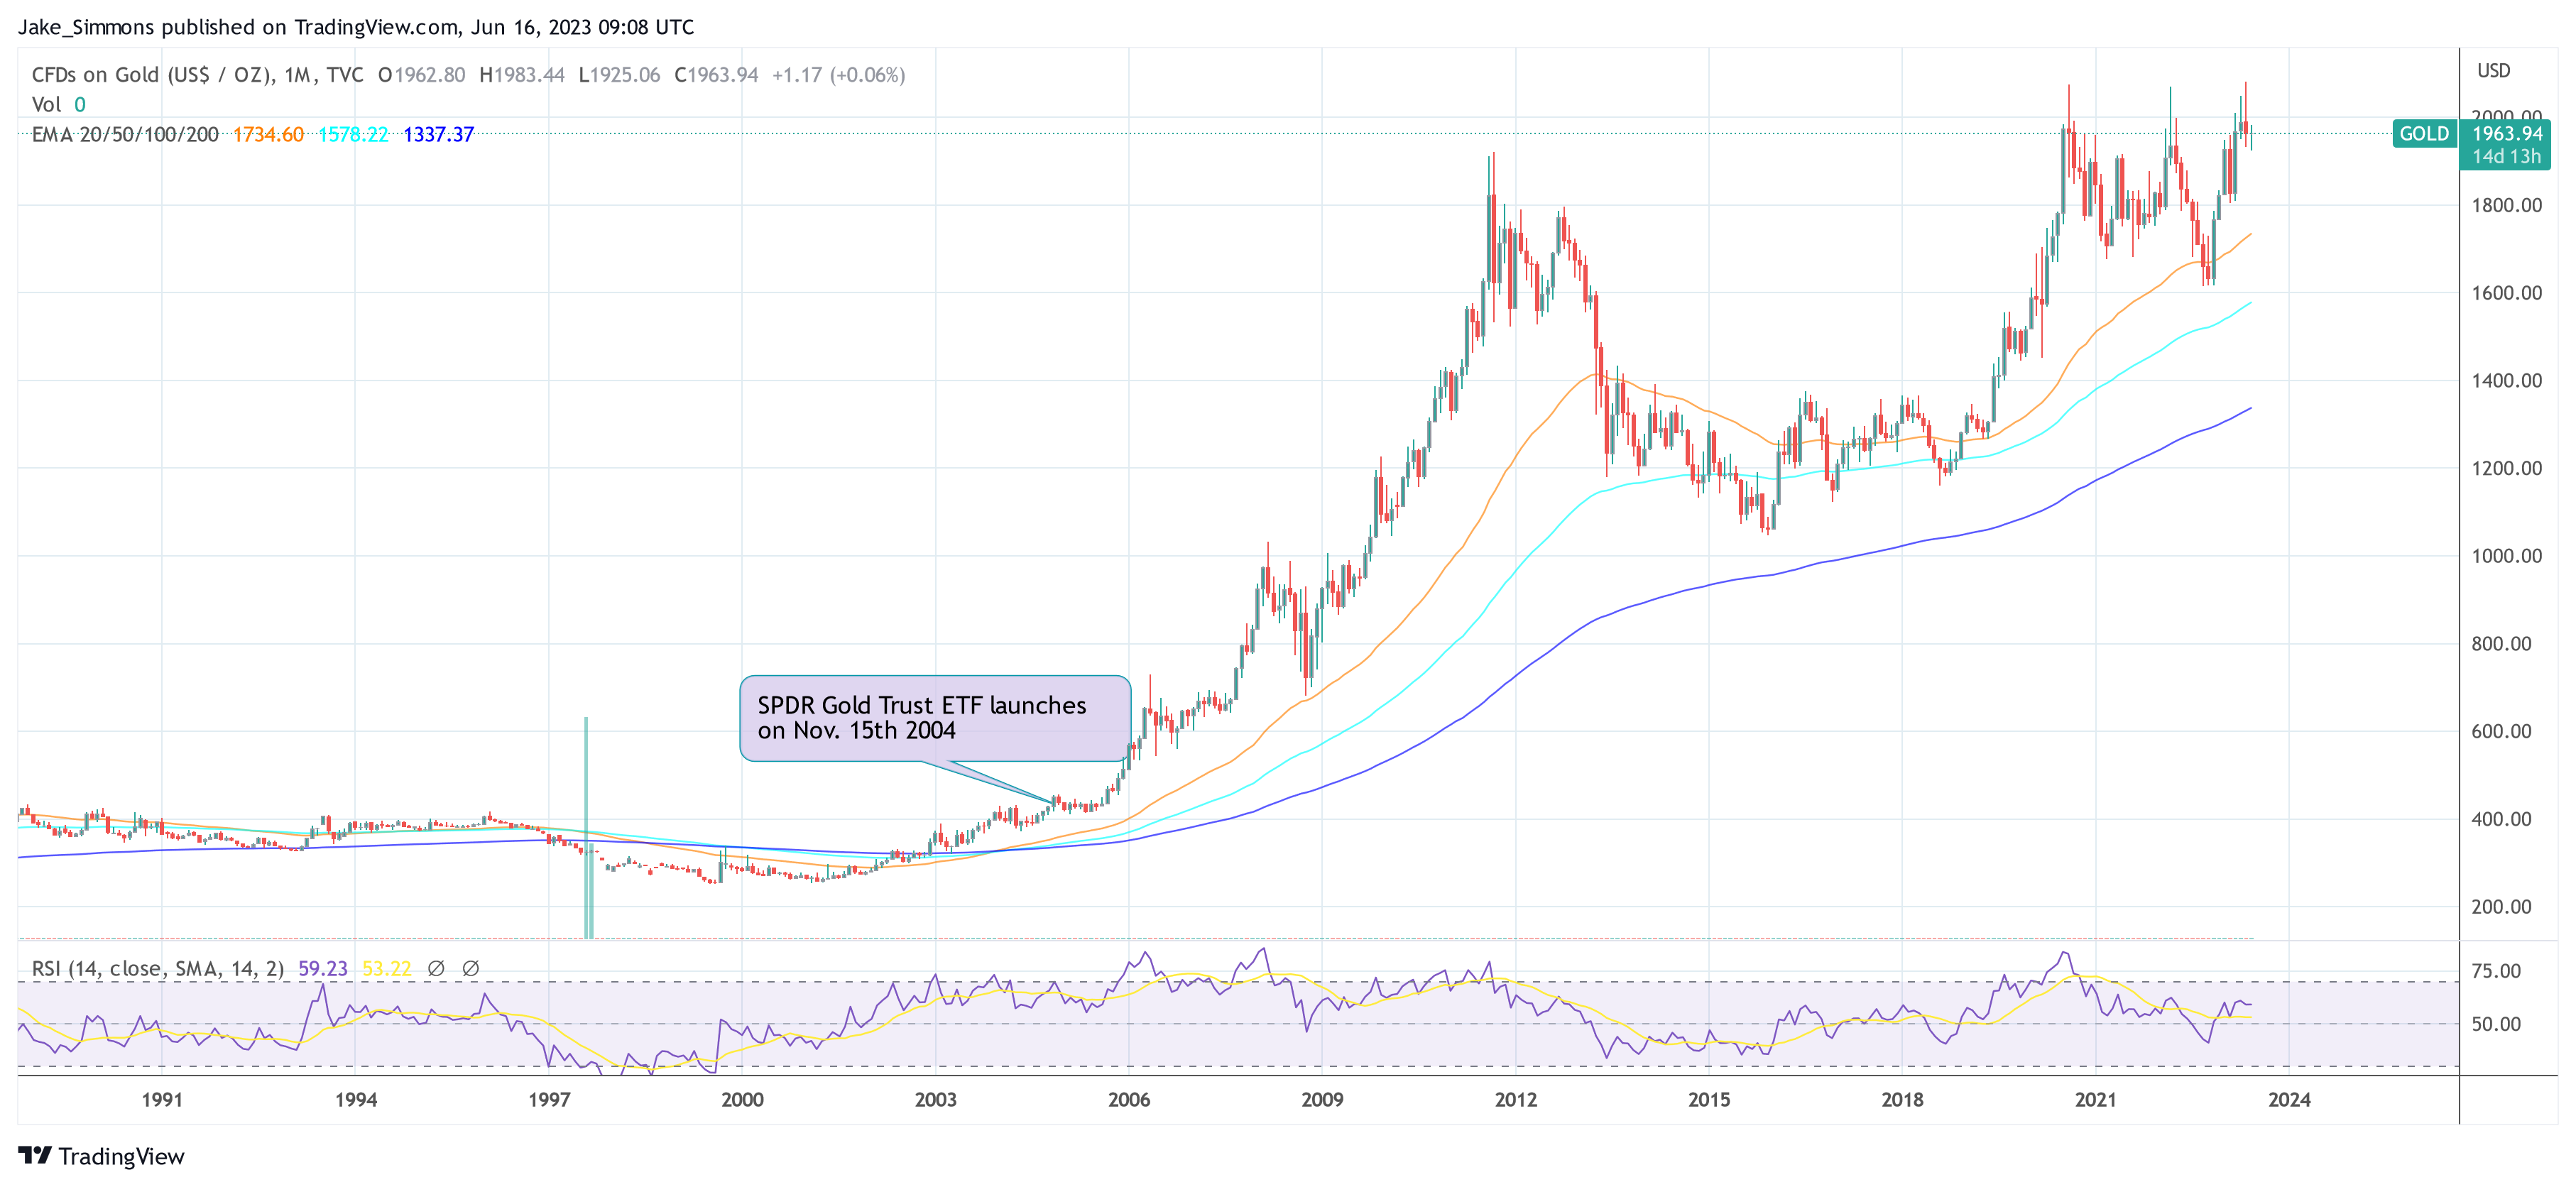
In September 2011, less than seven years after the launch, gold was trading at $1920 per ounce. Many economic factors have influenced the price of gold, but the launch of ETFs certainly played an influential role in attracting global institutional funds to the market.
The digital gold of the 21st century, Bitcoin, may yet see this price explosion if history repeats itself.
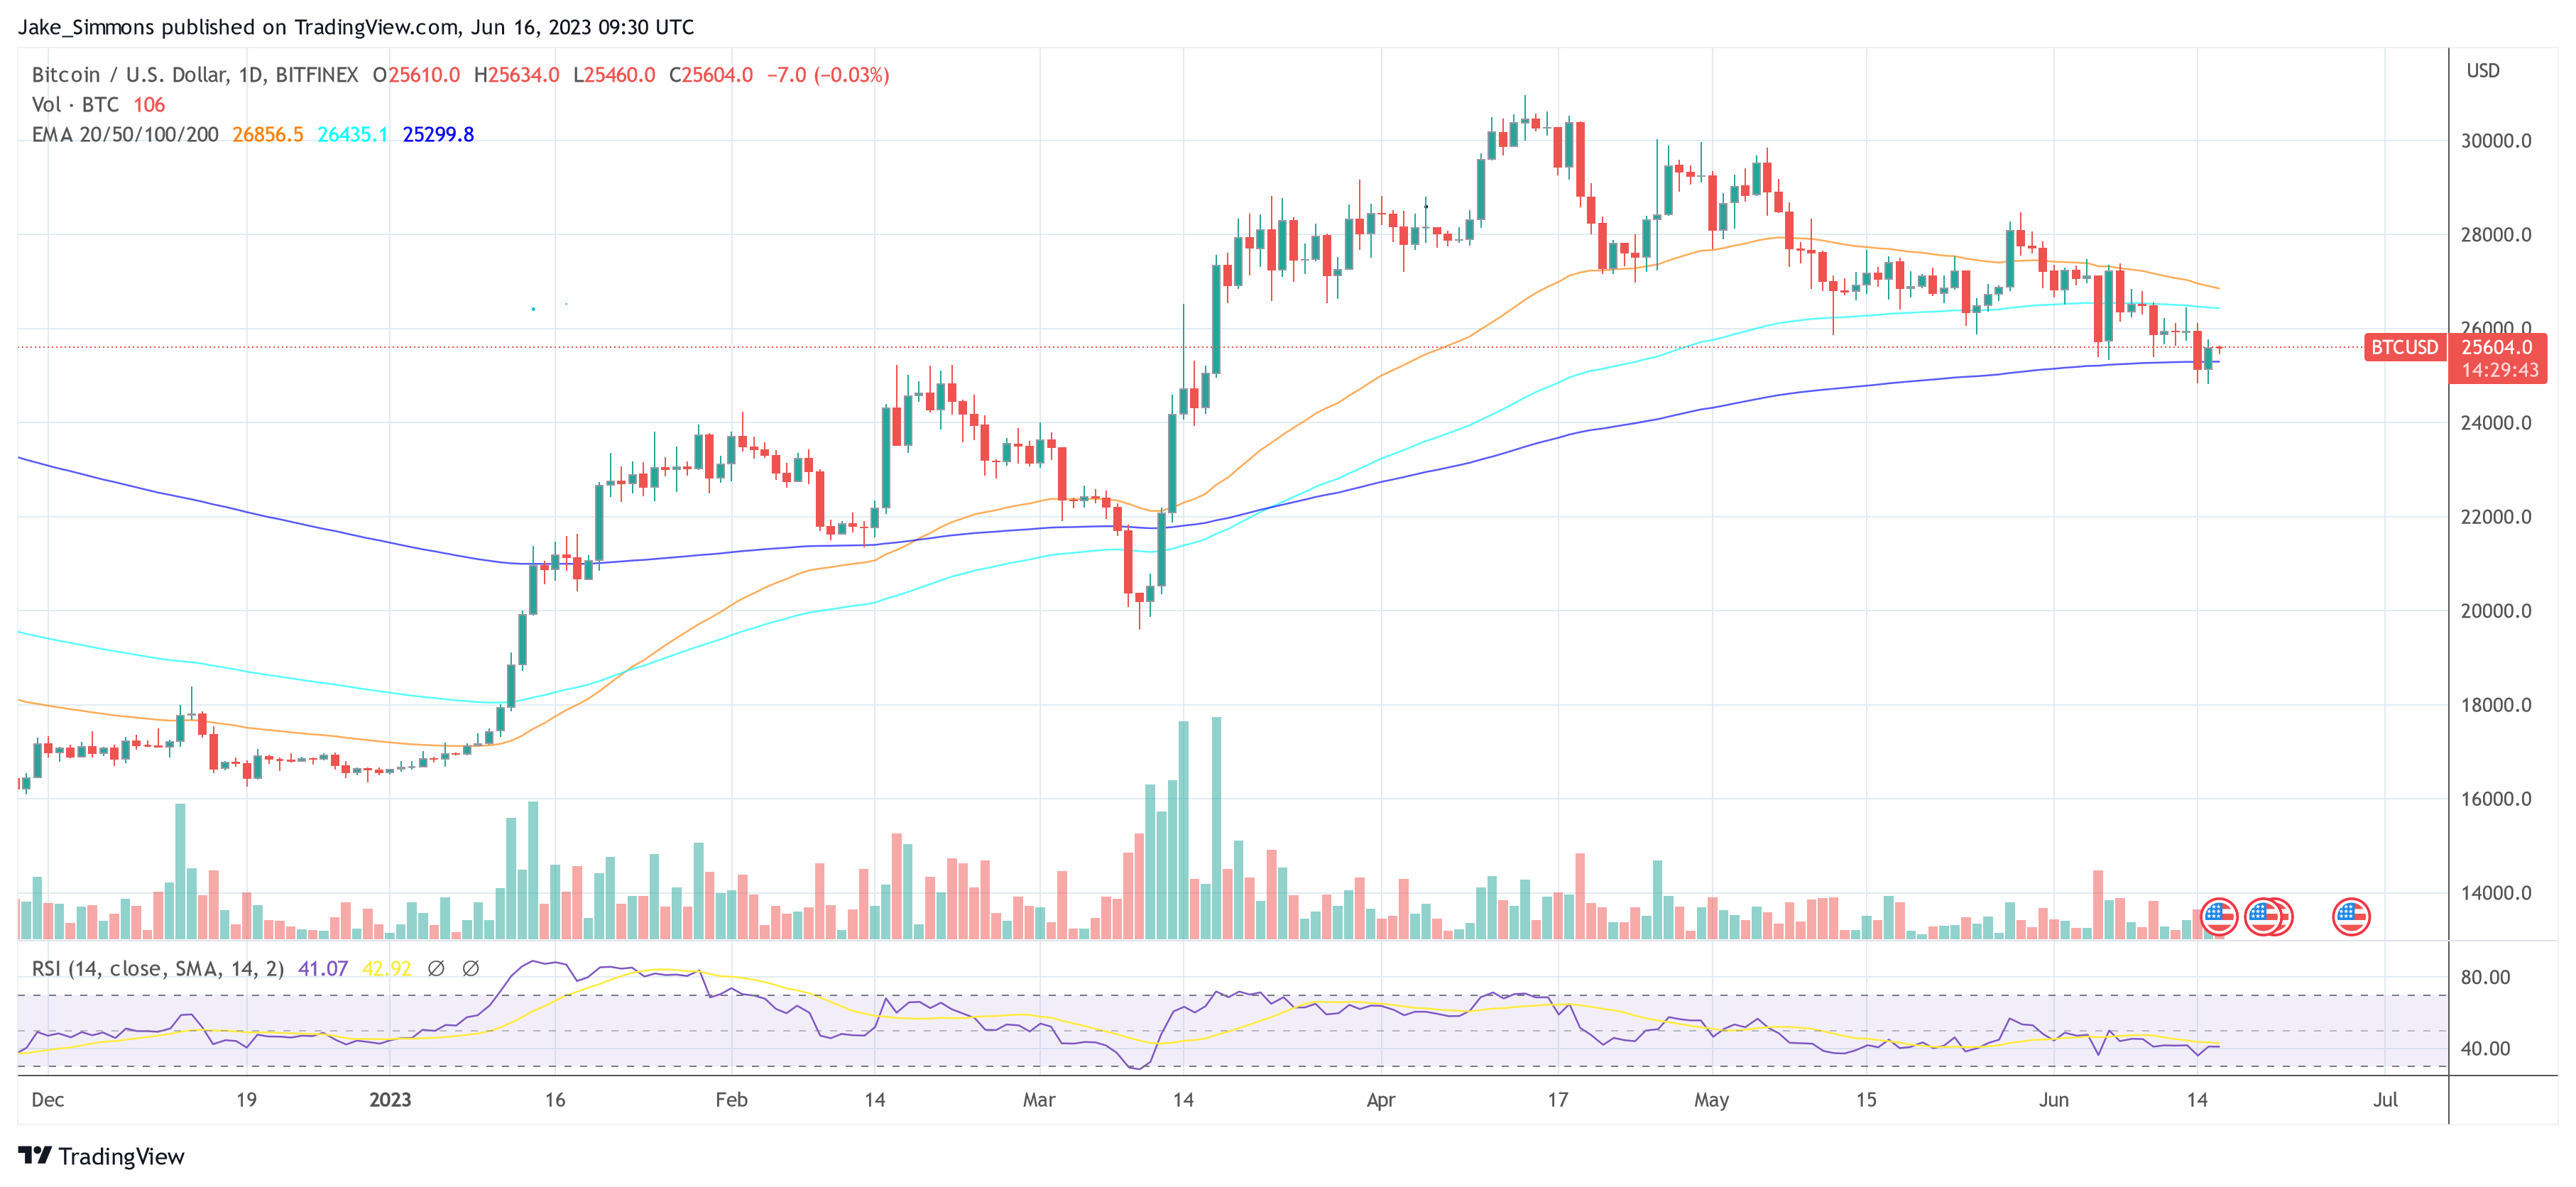
At press time, BTC traded at $25,604, reclaiming the 200-day EMA (blue line).
Featured image from iStock, chart from TradingView.com
Source link


On-chain data shows the supply of stablecoins has been going up recently, a sign that could potentially be bullish for Bitcoin.
Stablecoins Have Registered An Increase In Their Supply Recently
As pointed out by an analyst in a CryptoQuant post, every increase in stablecoins’ supply since late 2022 has been accompanied by a rise in the price of Bitcoin. The metric of interest here is naturally the combined circulating supply of all stablecoins.
When the value of this indicator rises, it means that capital is entering into the stables currently as more of their tokens are being minted. On the other hand, a decline implies investors are either redeeming these fiat-tied tokens for currencies like the dollar or shifting them into other cryptocurrencies like Bitcoin.
Generally, investors use stables whenever they want to avoid the volatility associated with most of the coins in the sector. Thus, whenever the supply of these tokens is going up, it can also be a sign that investors are possibly retreating from the volatile markets.
When such investors eventually feel like the prices are right to jump back into the other assets, they simply exchange their stablecoins for their desired coins. Naturally, this can provide bullish pressure on the price of the cryptocurrency that they are shifting into.
Now, here is a chart that shows the trend in the combined circulating supply of the stablecoins over the past year and a half:
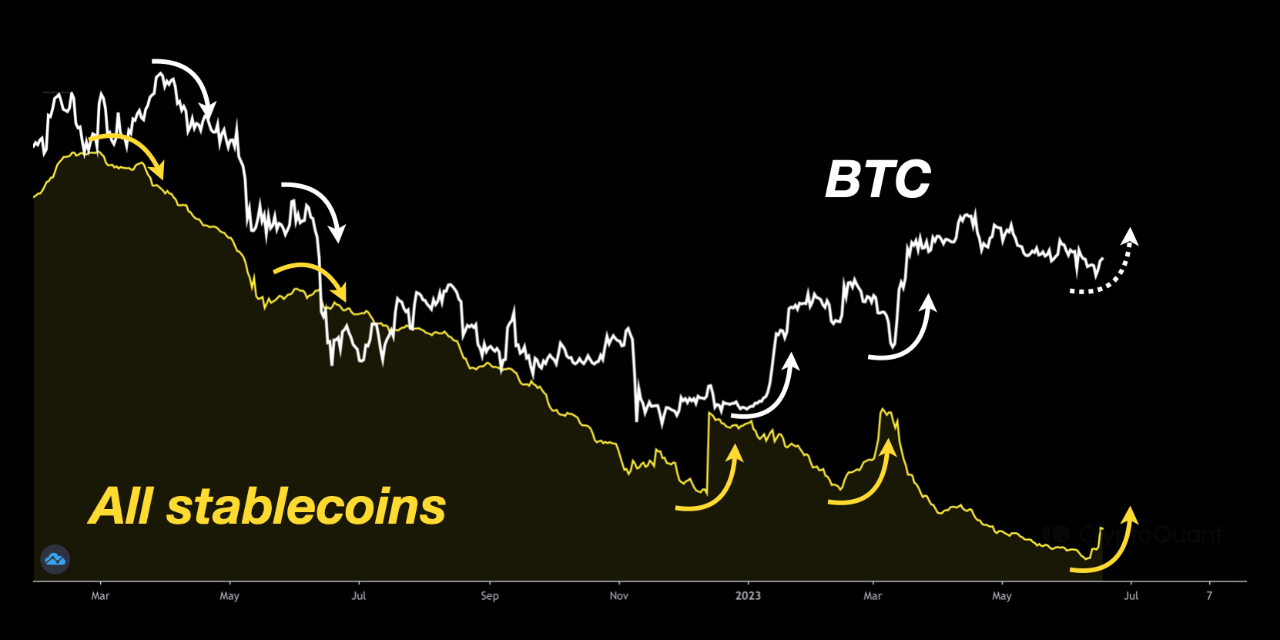
The value of the metric seems to have been going up in recent days | Source: CryptoQuant
As displayed in the above graph, the combined circulating supply of the stablecoins had started moving on an overall downtrend back when Bitcoin hit the bull market top. This decrease in the supply of these tokens implied the exit of capital from the market, as BTC and other coins also went down in value alongside this downtrend.
In late 2022, however, the indicator finally showed a brief deviation from the downward trajectory as its value registered a sharp increase. Interestingly, not too long after this spike appeared, the price of Bitcoin started observing its rally.
This increase in the supply of the stablecoins could have been a sign that a capital injection into the market took place, and as these freshly piled up stables were converted to the other coins, the market obtained its fuel for the rally.
In March of this year, when the rally had paused and the Bitcoin price had been going down, the metric had once again spiked, implying that investors may have possibly been withdrawing their BTC into the stables.
After the bottom below $20,000, however, the supply of the stablecoins once more dropped, suggesting that holders were potentially exchanging back into Bitcoin. Naturally, the price of the asset observed a bullish boost from this, as the rally kicked back on.
From the chart, it’s visible that the indicator has been rising again recently. Given that all such rises in the metric have been bullish for BTC during recent months, it’s possible that this fresh influx of capital can provide fuel for the asset this time as well.
BTC Price
At the time of writing, Bitcoin is trading around $26,400, up 2% in the last week.
The value of the asset has gone up over the weekend | Source: BTCUSD on TradingView
Featured image from CoinWire Japan on Unsplash.com, charts from TradingView.com, CryptoQuant.com
Source link
The bears lost an opportunity when they failed to sustain Bitcoin (BTC) below the $25,000 level this week. That may have attracted buying from the bulls who are attempting to start a recovery in Bitcoin and select altcoins.
Additionally, BlackRock’s application to launch a Bitcoin spot price exchange-traded fund and the sustained strength in the United States equities markets may have helped improve crypto sentiment. Bitcoin is on track to finish the week with a minor gain of 2% and institutional buying in the Grayscale Bitcoin Trust reduced its discount to Bitcoin spot from 44% on June 13 to 36.6%, according to CoinGlass data.
Although Bitcoin and select altcoins are trying to start a relief rally, the overall trend remains bearish. Therefore, short-term traders who buy for a pullback should consider booking profits or tightening their stops when the price struggles to break above stiff resistance levels.
The strategy may be different for long-term investors who may use the dips to strong support levels to acquire the cryptocurrencies of their choice. It is prudent to adopt a staggered buying approach as a runaway rally is unlikely.
Let’s look at the top-5 cryptocurrencies that are trying to start a recovery in the short term.
Bitcoin price analysis
Bitcoin turned up sharply on June 15, trapping the aggressive bears who may have gone short on a break below $25,250. That may have caused a short squeeze in the near term, which propelled the price to the 20-day exponential moving average ($26,403).
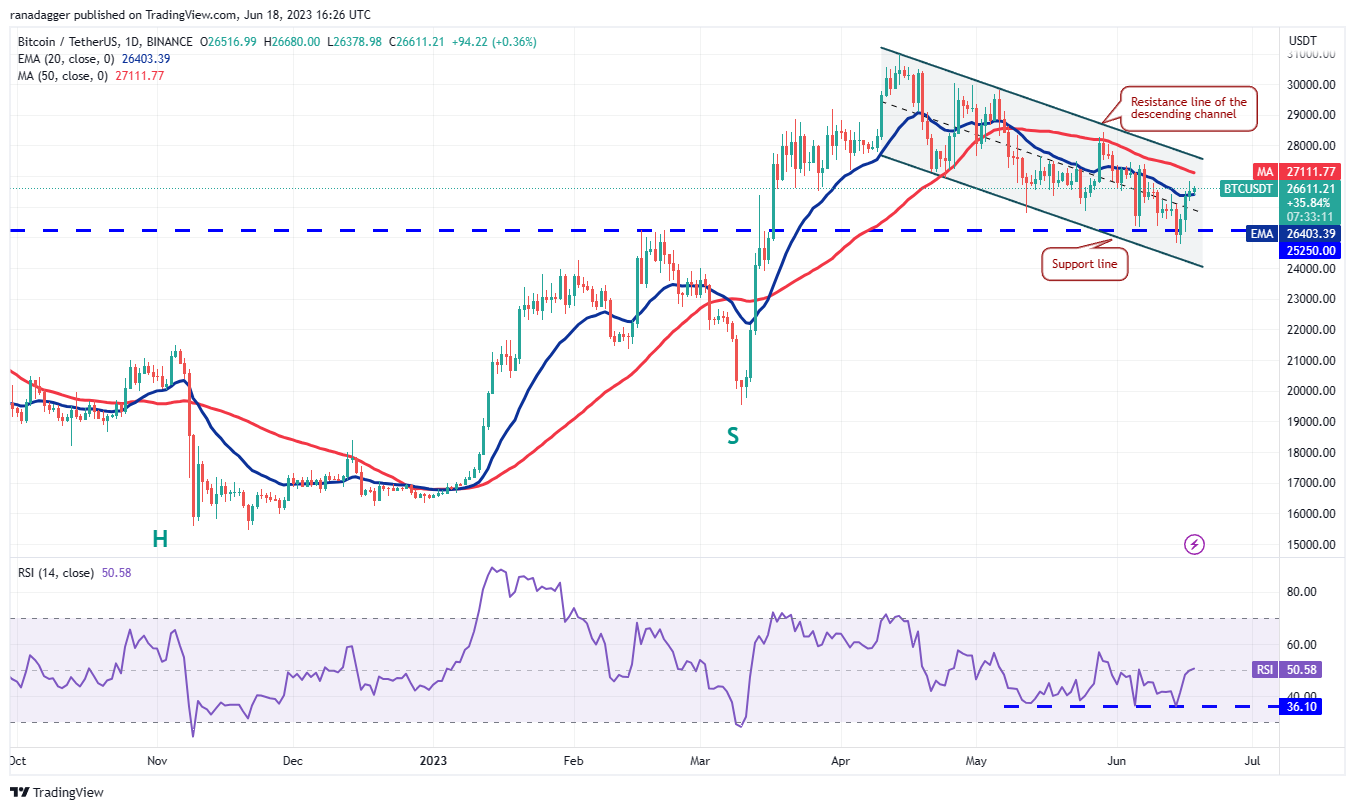
The bears are trying to limit the relief rally at the 20-day EMA but a positive sign is that the bulls have not given up much ground. This suggests that the buyers are holding on to their positions in anticipation of a move higher.
However, the bears are likely to have other plans as they will try to offer stiff resistance in the zone between the 20-day EMA and the resistance line of the descending channel. If the price turns down from this zone, the BTC/USDT pair may remain inside the channel for a while longer.
But if bulls drive the price above the channel, the pair will signal a potential trend change in the near term. The pair could then surge toward $31,000.
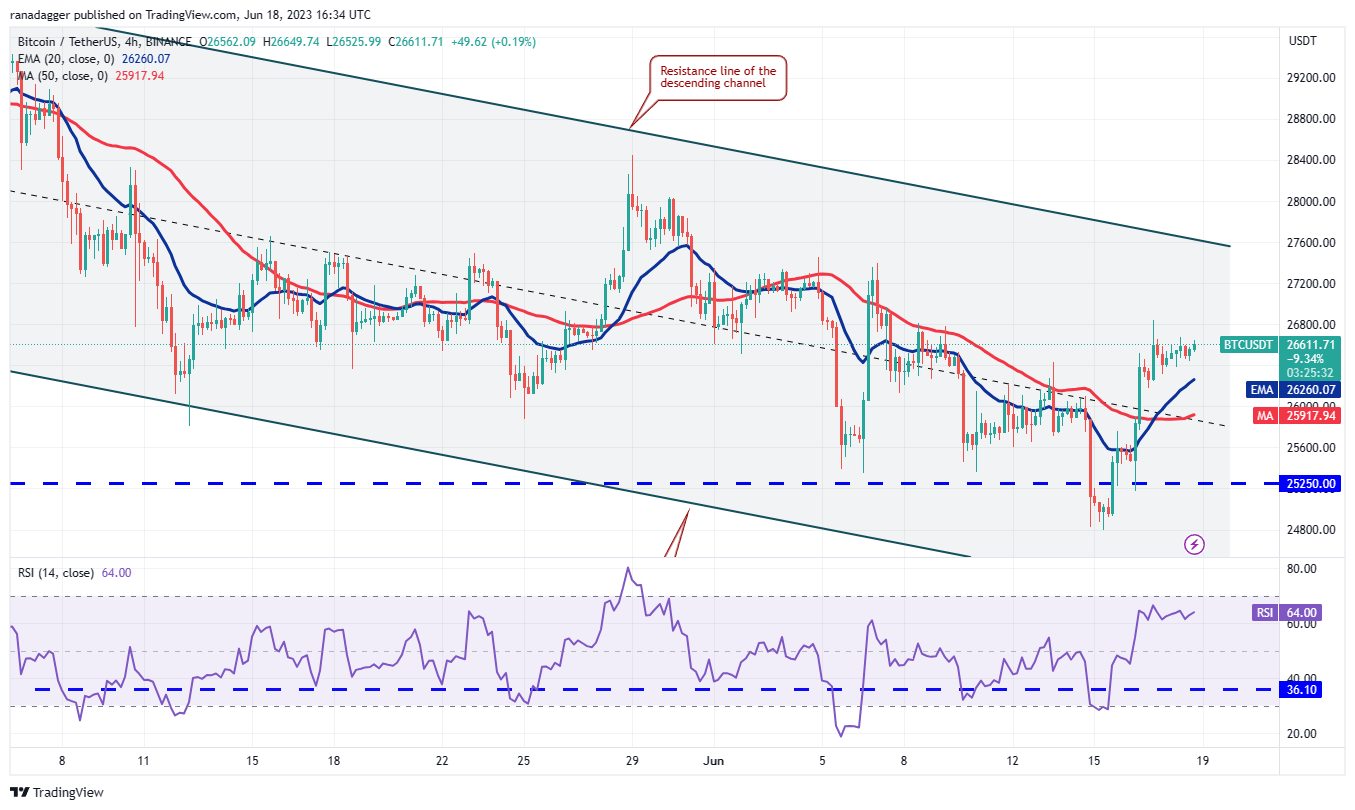
The 20-EMA on the 4-hour chart has turned up and the relative strength index (RSI) is in the positive area, indicating that bulls have the upper hand in the near term. There is a minor resistance at $26,850 but if that is crossed, the pair may reach the resistance line of the channel near $27,600. This level may prove to be a difficult hurdle for the bulls to cross but if they manage to do that, the pair could rally to $28,500.
This positive view will invalidate in the short term if the price turns down and breaks below the 20-EMA. That could pull the price down to the 50-simple moving average and eventually to the strong support zone between $25,250 and $24,800. A break below this zone may intensify selling.
BNB price analysis
BNB (BNB) has been in the thick of things for the past few days but a positive sign is that the bulls did not allow the price to break the $220 support. This indicates demands at lower levels.
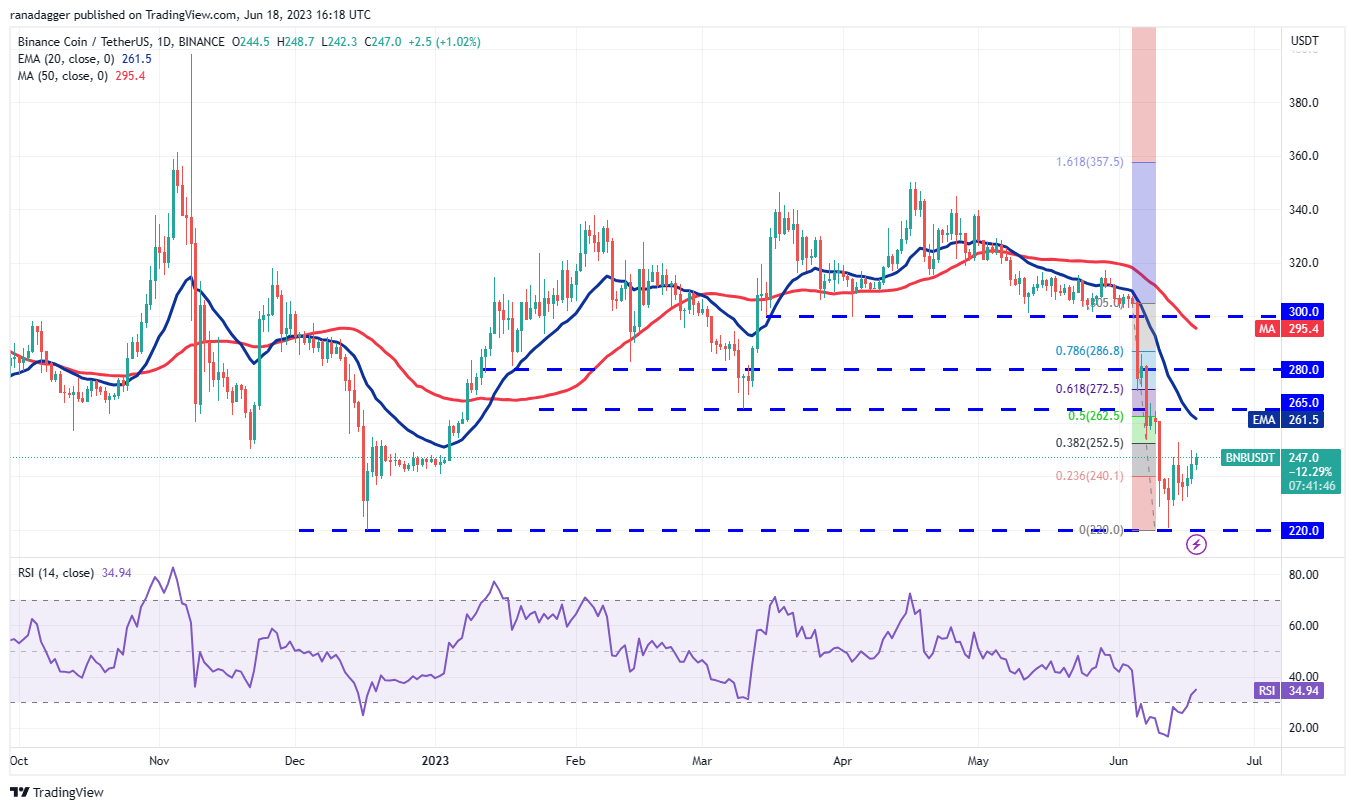
The first resistance on the upside is the 38.2% Fibonacci retracement level of $252.50. If this level is scaled, the BNB/USDT pair may reach the 20-day EMA ($261). The bears will try to halt the recovery at this level. If they succeed, the pair may turn down toward $220.
On the contrary, if bulls propel the price above the 20-day EMA, the pair could reach the 61.8% Fibonacci retracement level of $272.50. This is a crucial level for the bears to defend because if it gives way, the pair may soar toward $305.
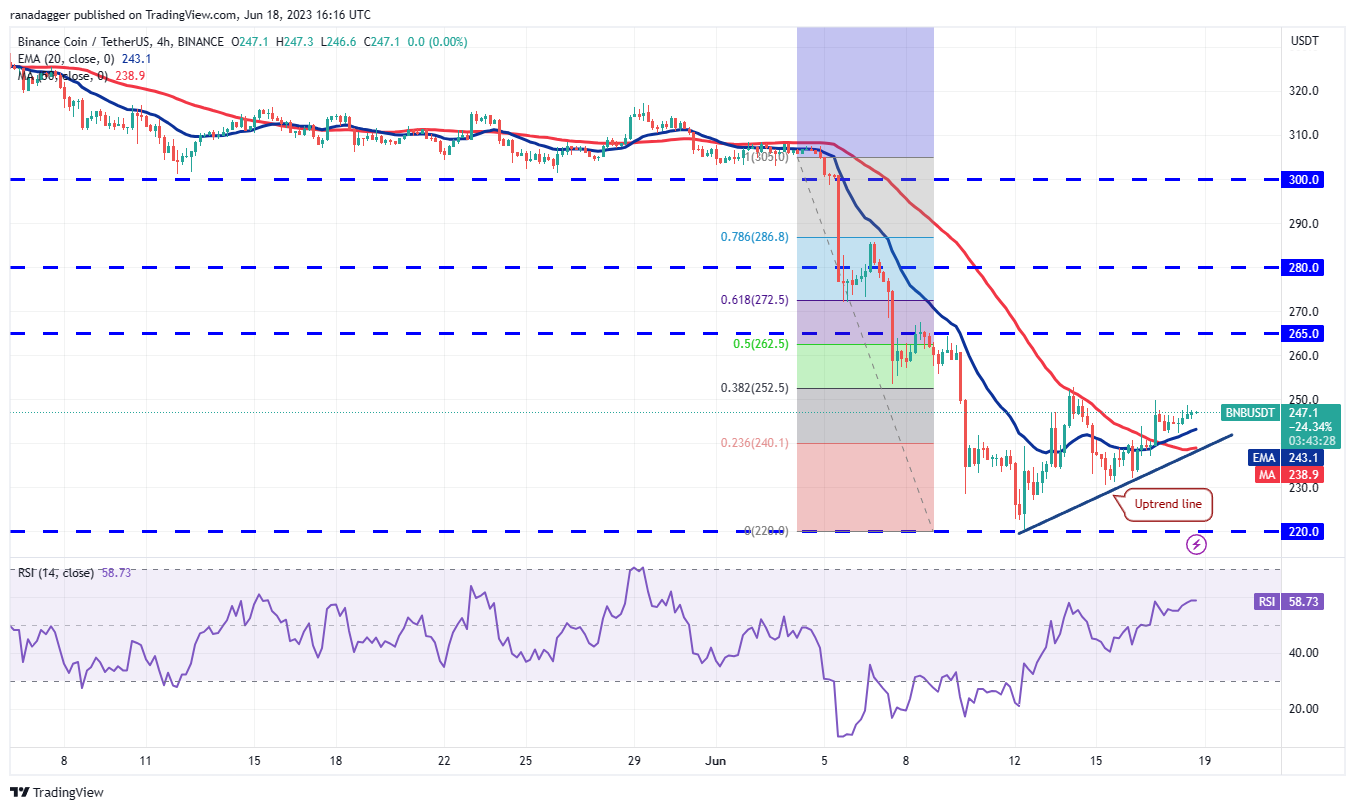
The 4-hour chart shows that the moving averages have completed a bullish crossover and the RSI has risen into the positive zone. This indicates that buyers are attempting a comeback. The bulls will have to overcome the barrier at $252.50 to gain strength. The pair could then rally to $265.
On the downside, the first support is at the 20-EMA. If this level breaks down, the pair could slip to the uptrend line. A break and close below this level will indicate that the bulls have given up. The pair could then retest the critical support at $220.
Litecoin price analysis
Litecoin (LTC) plunged below the symmetrical triangle pattern on June 10, indicating that bears have the upper hand. The sellers pulled the price below the immediate support at $75 on June 14 but could not build upon this move.
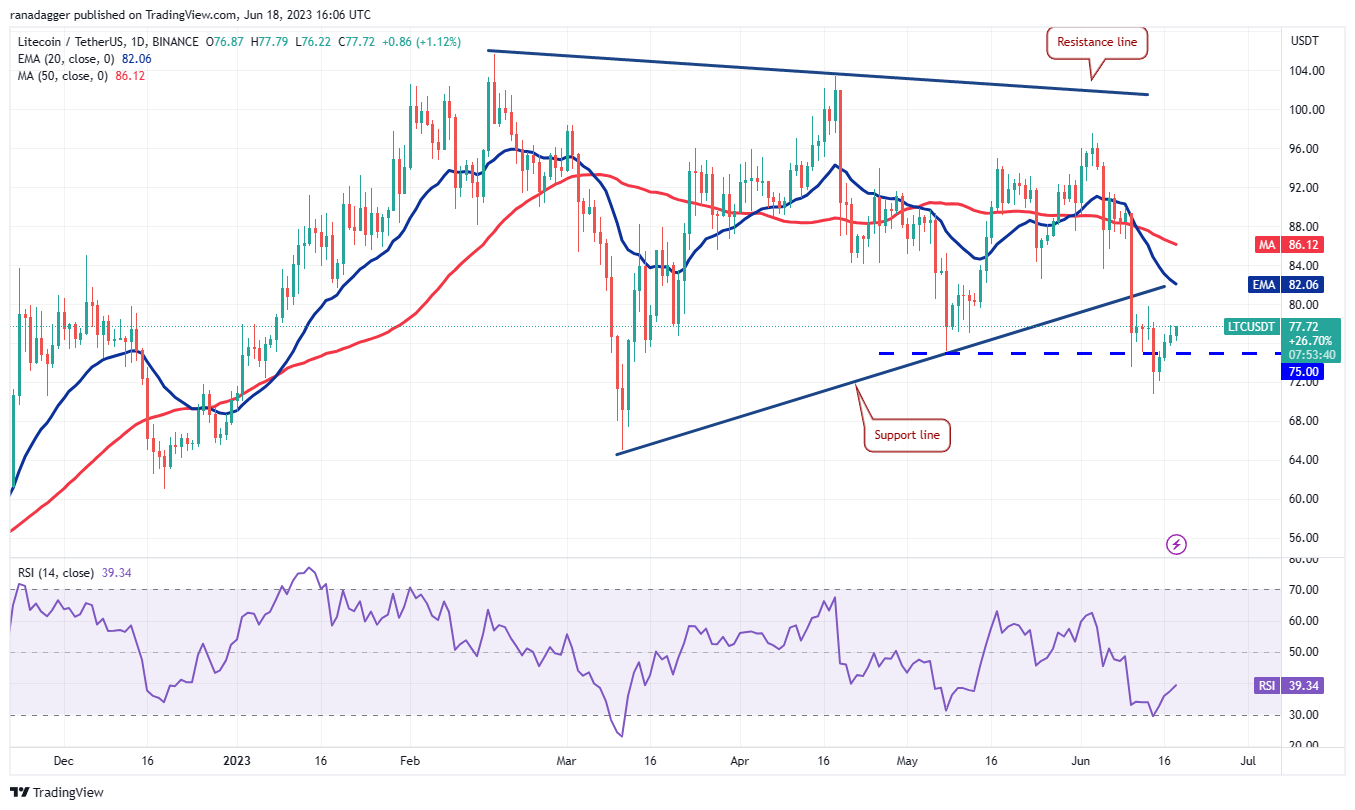
The sharp recovery in the past few days has pushed the LTC/USDT pair back above $75. This shows strong buying at lower levels. The bulls will next try to push the price to the 20-day EMA ($82), which is an important level to keep an eye on. If buyers clear this hurdle, the pair may rise to the 50-day SMA ($86).
Contrary to this assumption, if the price turns down from the current level or the 20-day EMA and breaks below $70, it will signal the start of the downtrend. The first stop is likely to be $65 and then $60.
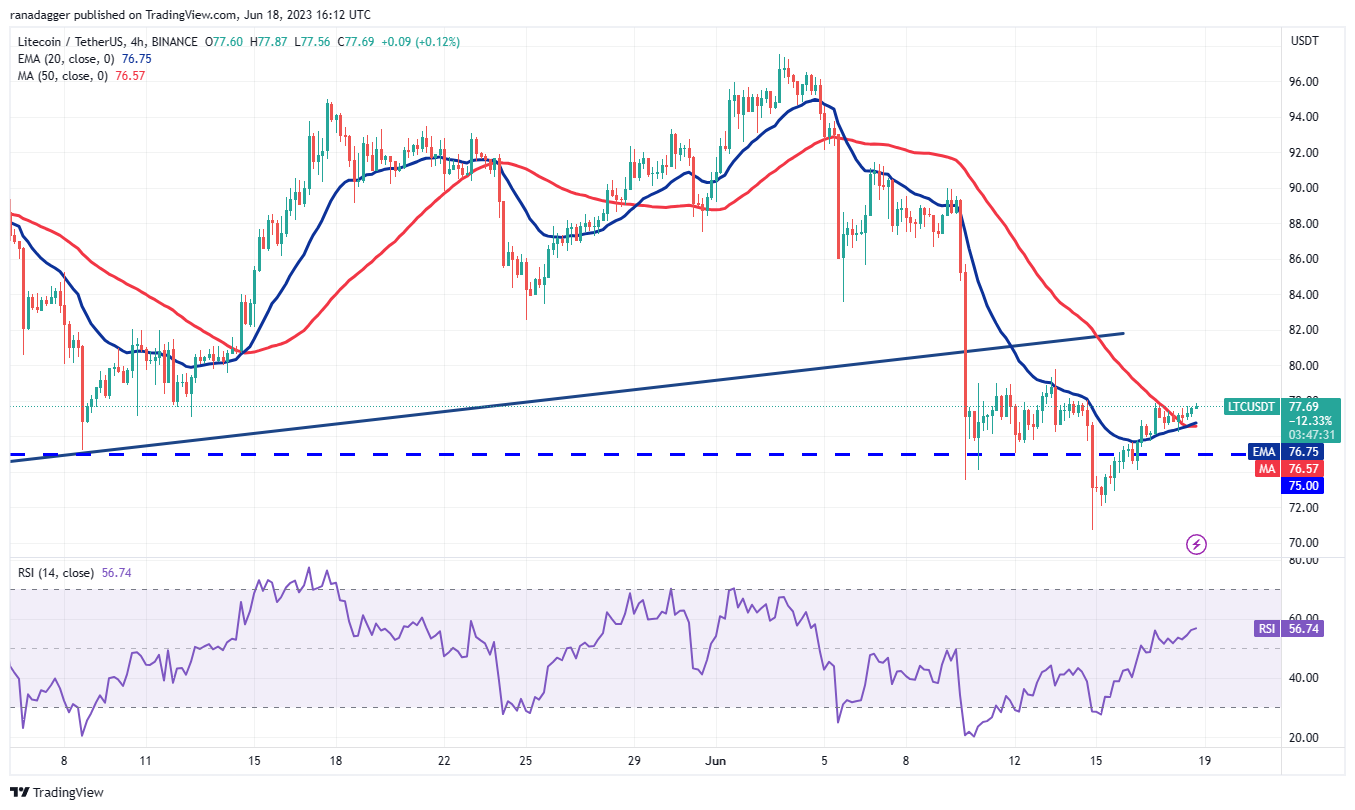
The strong recovery pushed the price above the 20-EMA on the 4-hour chart, suggesting that the selling pressure is reducing. The moving averages are on the verge of completing a bullish crossover and the RSI has jumped into the positive territory, indicating that buyers are attempting a comeback.
There is a minor resistance at $80 but if bulls overcome this obstacle, the pair may accelerate to $85 and thereafter to $90. If bears want to prevent the up-move, they will have to quickly yank the price back below $75.
Related: Binance sends cease and desist notice to fraudulent Nigerian entity
OKB price analysis
OKB (OKB) broke below the symmetrical triangle pattern on June 10, signaling the start of a deeper correction. A minor positive for the bulls is that they successfully defended the support at $30.50, indicating demand at lower levels.
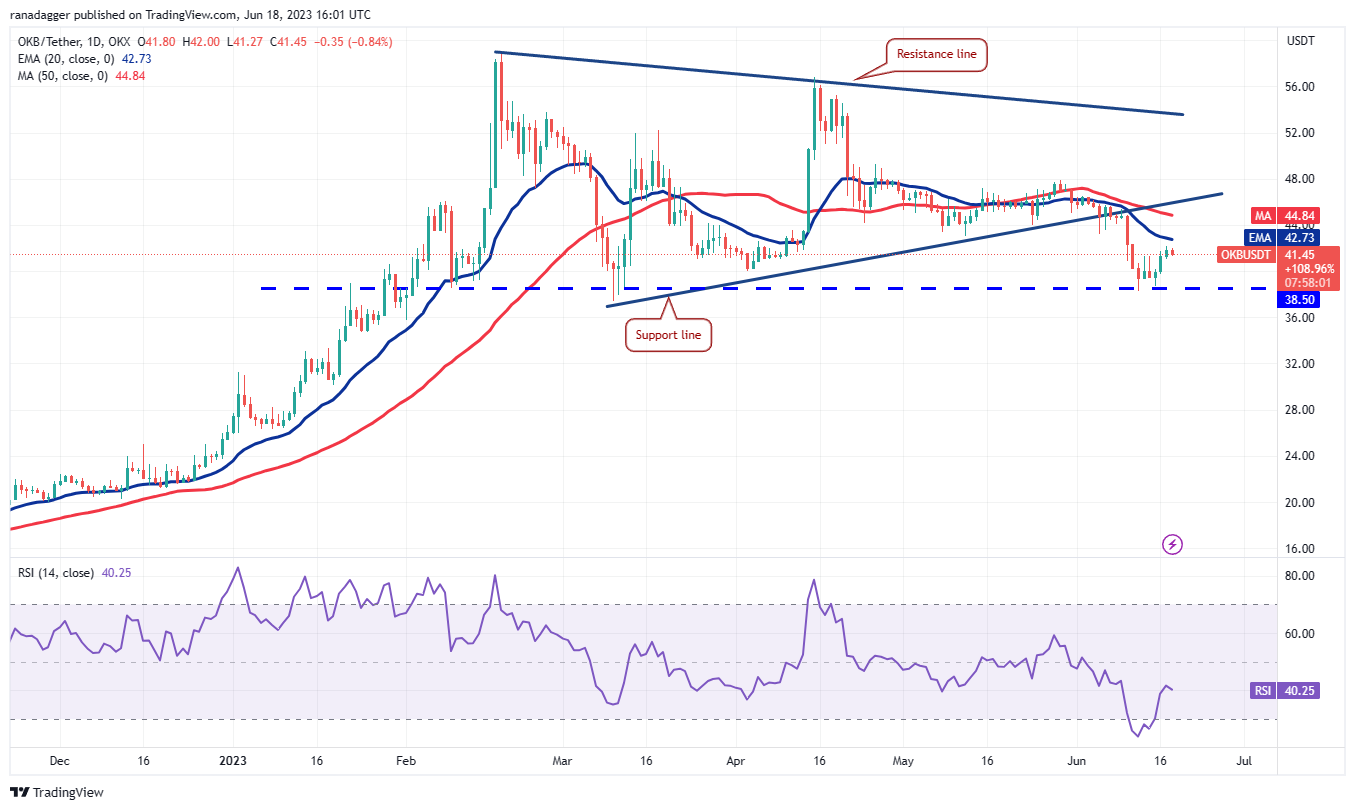
The price has reached the 20-day EMA ($42.73), which is an important level to watch out for. If the price turns down from the current level, it will suggest that the sentiment remains negative and traders are selling on rallies. That could pose a serious threat to the $38.50 support. If this level gives way, the OKB/USDT pair may skid to $35 and eventually to $30.
Contrarily, if buyers thrust the price above the 20-day EMA, it will suggest that the bears may be losing their grip. The pair could then rise to the support line, which is likely to act as a formidable resistance. Buyers will have to kick the price above $48 to gain the upper hand.
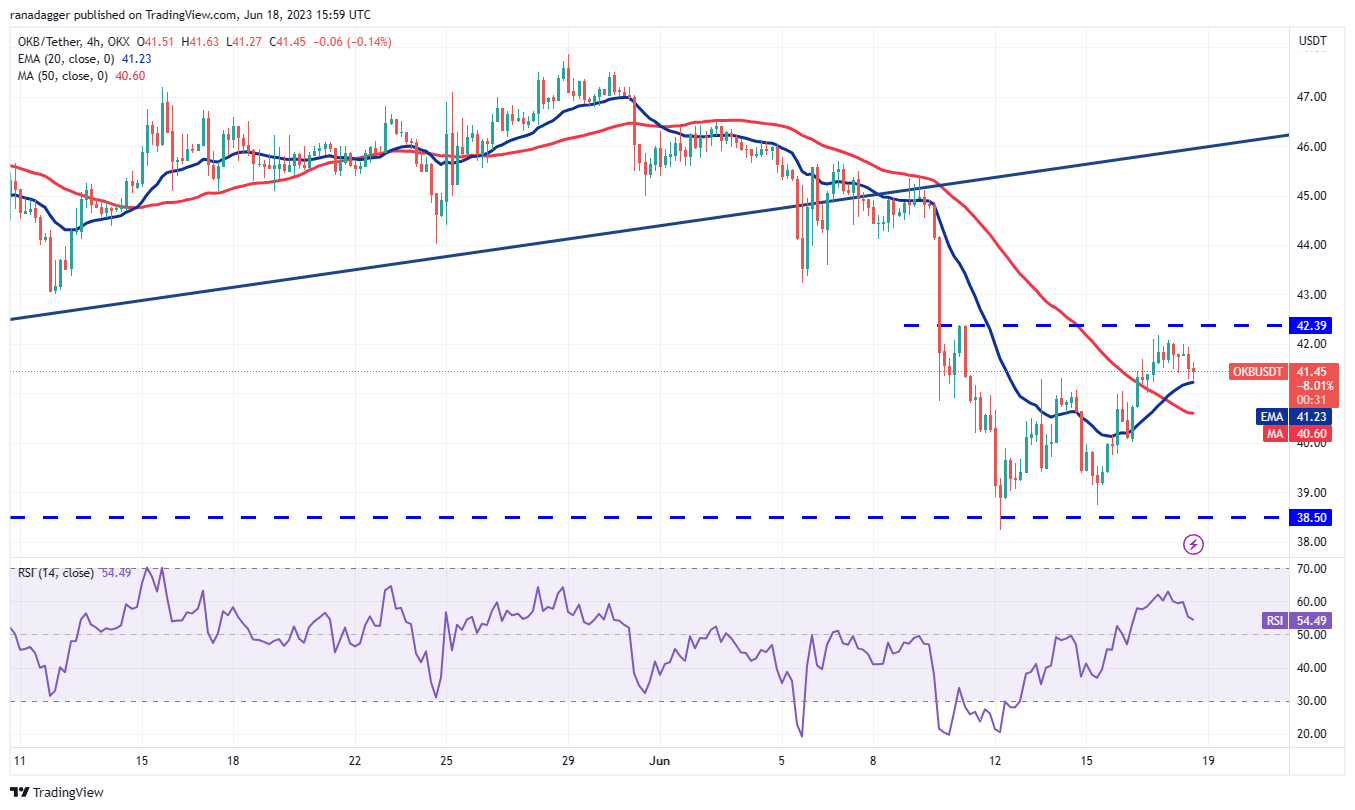
The pair bounced off $38.50 with vigor but is facing resistance near $42.39. A minor positive in favor of the buyers is that the moving averages have completed a bullish crossover and the RSI is in the positive territory.
If buyers thrust the price above $42.39, the pair may pick up momentum and soar to $46 where the bears are again expected to mount a strong defense.
Another possibility is that the price turns down and tumbles below the 20-EMA. That may indicate a possible range-bound action between $38.50 and $42.39 for some time.
Quant price analysis
Quant (QNT) rebounded off the $95 level with strength on June 16, indicating aggressive buying at the support.
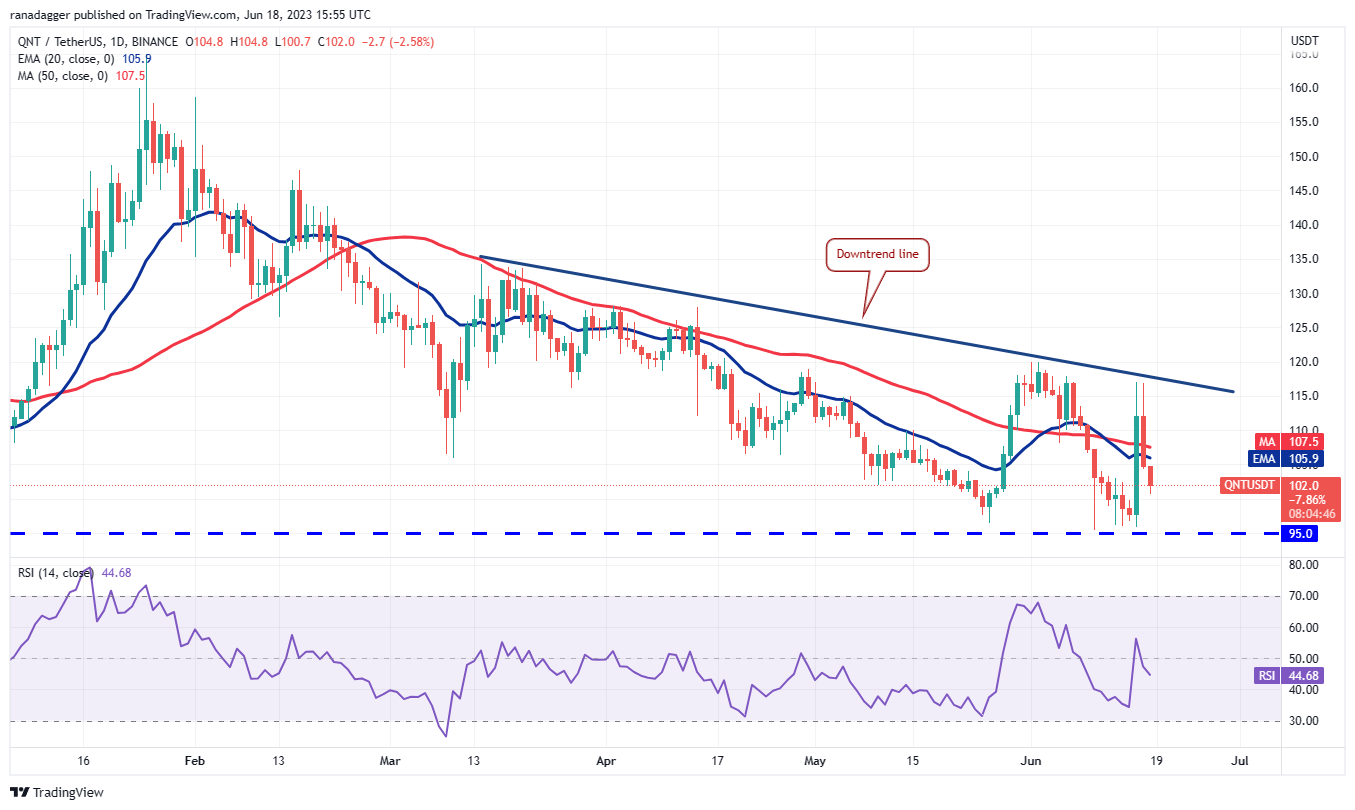
However, the bears have not yet given up and they are fiercely defending the downtrend line. Sellers will try to sink the price below $95 while the bulls will try to maintain the QNT/USDT pair above it.
If the price turns up from $95 once again, it will enhance the prospects of a rally above the downtrend line. If that happens, the pair may start a strong recovery that could catapult the price to $135.
This positive view could invalidate in the near term if the price continues lower and plummets below $95. The pair may then slip to $87 and subsequently to $80.
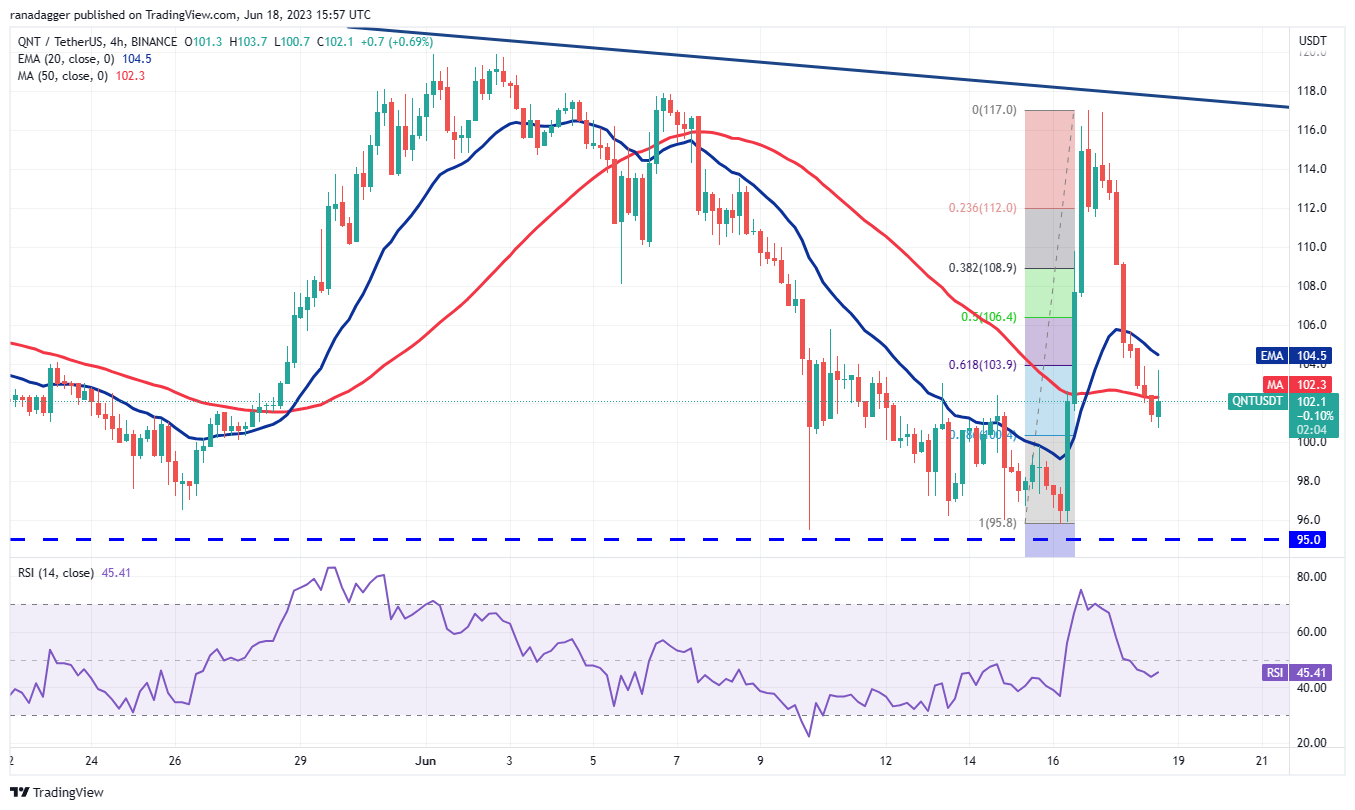
The 4-hour chart shows that the pair quickly gave back a major portion of its gains, indicating that bears are active at higher levels. They pulled the price below the 61.8% Fibonacci retracement level of $103.90, which is a negative sign.
Buyers will have to quickly drive the price back above the moving averages if they want to have another shot at the downtrend line. Alternatively, if the price sustains below the 50-SMA, the likelihood of a drop to $95 increases.
This article does not contain investment advice or recommendations. Every investment and trading move involves risk, and readers should conduct their own research when making a decision.
This article is for general information purposes and is not intended to be and should not be taken as legal or investment advice. The views, thoughts, and opinions expressed here are the author’s alone and do not necessarily reflect or represent the views and opinions of Cointelegraph.
Source link


Sentenced To 4 Months In Montenegrin Jail

Realtor may have accepted $3M offer for Washington, DC property linked to Sam Bankman-Fried

Stablecoins Supply Finally Shows Rise, Here’s Why This Is Bullish For Bitcoin

Do Kwon gets 4 months in prison in Montenegro on fake passport charges

TWT Tallies 30% In Last Week, Will It Test $1 Mark?

Kenny Schachter reflects on blockchain art’s past, present and future

ZachXBT Legal Fight Turns Into Funding Success

Binance cancels registration in the UK amid regulatory scrutiny

PEPE Sustains Steady Ascent, Fueling Speculation of Profits

‘Britcoin’ launch inches closer after Project Rosalind CBDC tests

Binance Coin Defies Regulatory Pressure, Holds $220 Support

Do Kwon denies forging passport, blames ‘Chinese’ agency: Report

Fresh Increase Possible Above 100 SMA

Coinbase blasts SEC for ‘no straight answers’ following court order

Ethereum Price Prints Bullish Technical Pattern, Why Close Above $1,780 Is Critical

Judge rules LBRY video platform’s token is a security in case brought by the US SEC

Silvergate Capital’s crypto-to-fiat transfers decrease by $50B compared to Q3 2021

Will the Bitcoin mining industry collapse? Analysts explain why crisis is really opportunity

Exchange Outflows Shows Bitcoin, Ethereum Accumulation Trend Continues

Bitcoin Dropped Below 2017 All-Time-High but Could Sellers be Getting Exhausted? – Blockchain News, Opinion, TV and Jobs
BNM DAO Token Airdrop

What does the Coinbase Premium Gap Tell us about Investor Activity? – Blockchain News, Opinion, TV and Jobs
Fed policy and crumbling market sentiment could send the total crypto market cap back under $1T
New Minting Services

Can Cardano’s July hard fork prevent ADA price from plunging 60%?

SEC’s Chairman Gensler Takes Aggressive Stance on Tokens – Blockchain News, Opinion, TV and Jobs

Friends or Enemies? – Blockchain News, Opinion, TV and Jobs

LUNA2 Recovers 70% In Nine Days From Historic Lows

Enjoy frictionless crypto purchases with Apple Pay and Google Pay | by Jim | @blockchain | Jun, 2022
A String of 200 ‘Sleeping Bitcoins’ From 2010 Worth $4.27 Million Moved on Friday
-
 SEC7 months ago
Judge rules LBRY video platform’s token is a security in case brought by the US SEC
-
 Banking8 months ago
Silvergate Capital’s crypto-to-fiat transfers decrease by $50B compared to Q3 2021
-
 Antminer11 months ago
Will the Bitcoin mining industry collapse? Analysts explain why crisis is really opportunity
-
 Bitcoin8 months ago
Exchange Outflows Shows Bitcoin, Ethereum Accumulation Trend Continues
-
 Altcoins12 months ago
Bitcoin Dropped Below 2017 All-Time-High but Could Sellers be Getting Exhausted? – Blockchain News, Opinion, TV and Jobs
-
Uncategorized1 year ago
BNM DAO Token Airdrop
-
 Binance11 months ago
What does the Coinbase Premium Gap Tell us about Investor Activity? – Blockchain News, Opinion, TV and Jobs
-
 Asia11 months ago
Fed policy and crumbling market sentiment could send the total crypto market cap back under $1T