
BTC
XRP Exhibits Bearish Chart Pattern
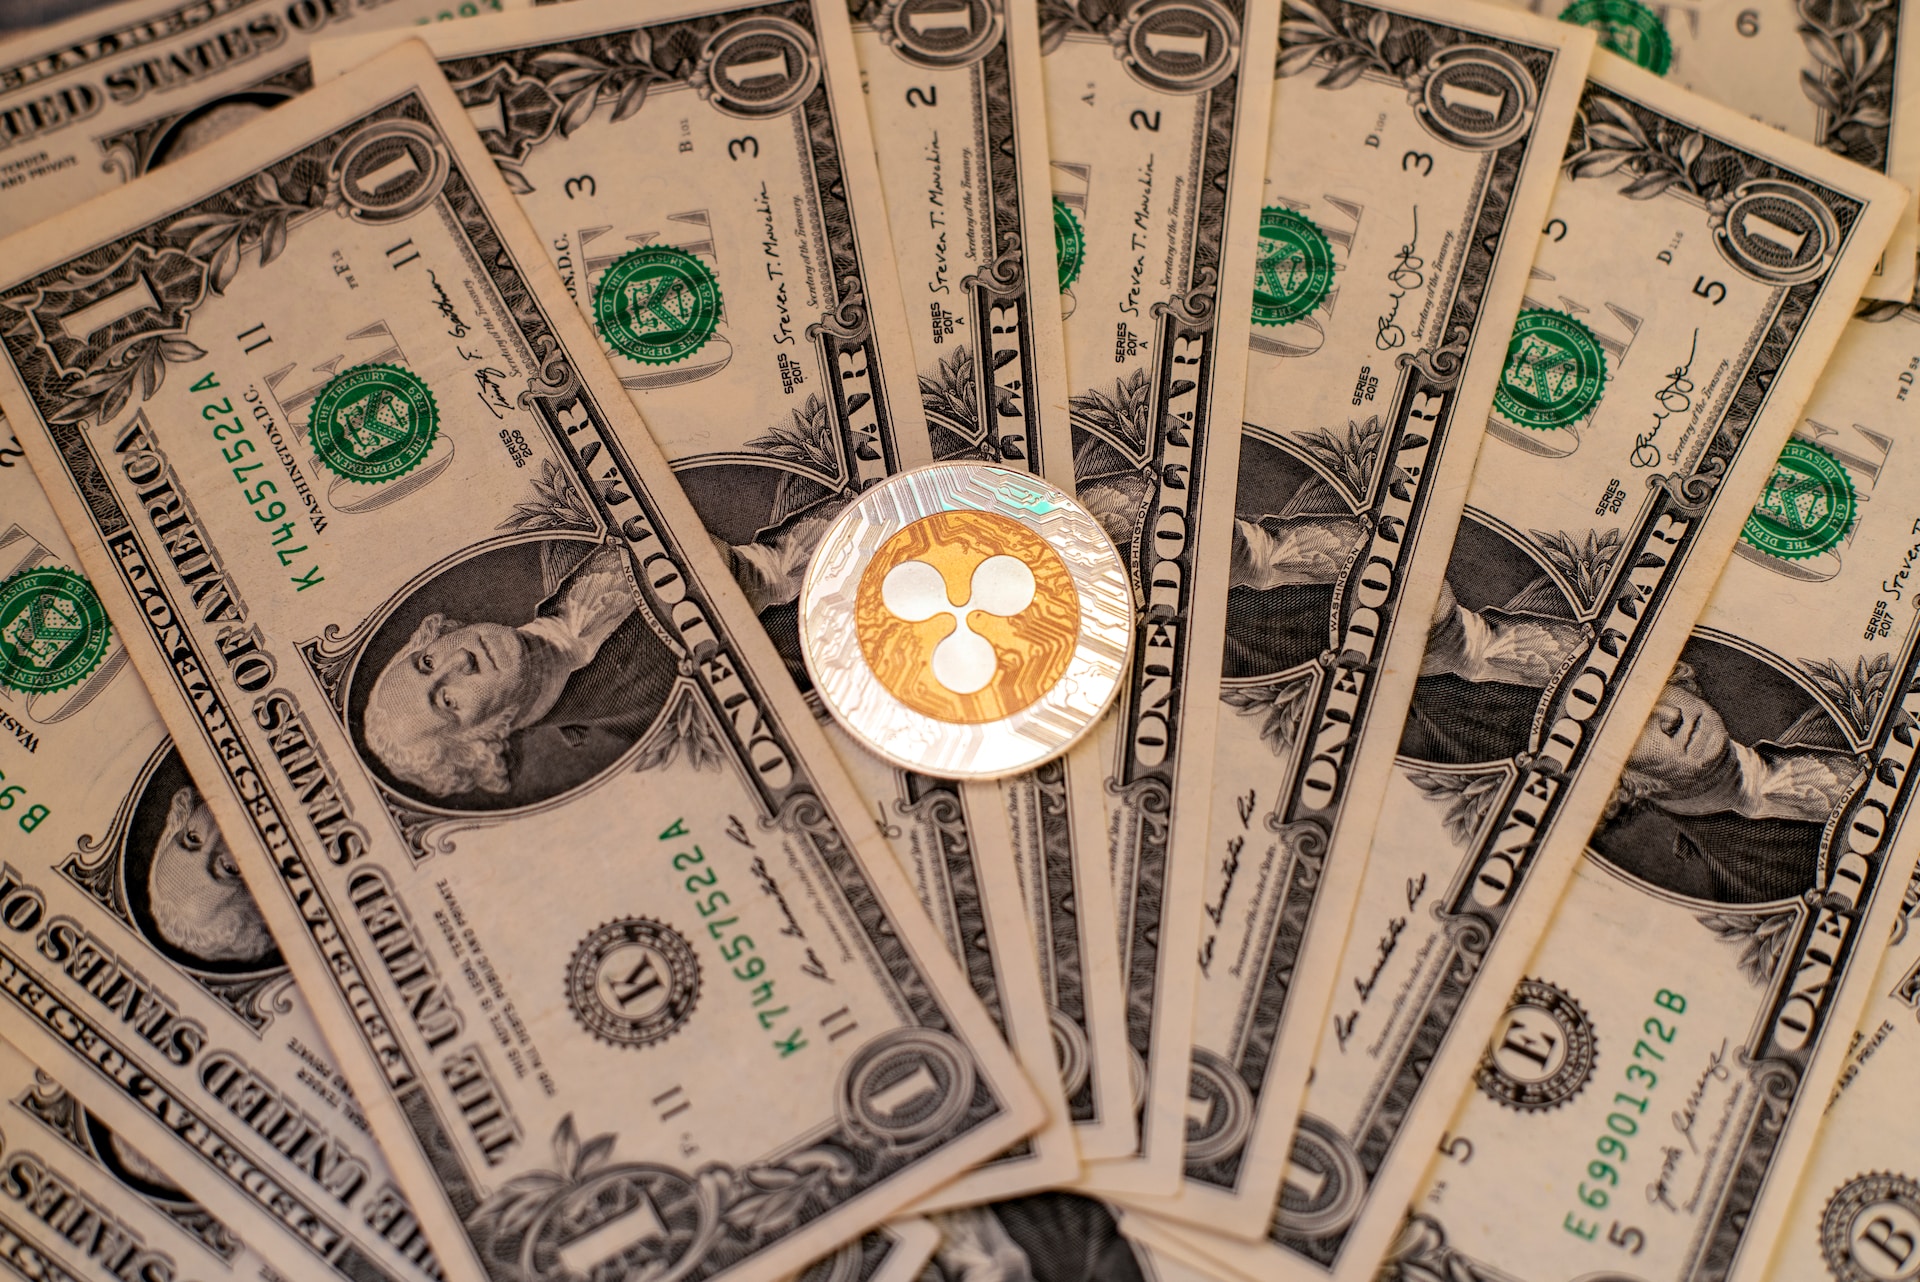
In the past 48 hours, the price of XRP has experienced notable volatility, dropping below $0.50. The crypto market is closely focused on XRP due to a recent favorable development in the Securities and Exchange Commission (SEC) vs. Ripple lawsuit.
The emergence of the Hinman documents has sparked inquiries into the actions of the Securities and Exchange Commission. Although XRP witnessed positive price action earlier this year, the altcoin has faced challenges due to ongoing market volatility. This has led to a break below significant support levels.
Over the last 24 hours, XRP has seen a close to 7% dip. There has been an 8% depreciation on the weekly chart. Both the demand and accumulation of the asset have remained low. This indicated a dominant bearish trend. The fear index remains high in the market, contributing to a decline in investor confidence.
Failure to surpass the $0.50 level may result in a significant loss of value for XRP during the next trading session. Furthermore, the decrease in the altcoin’s market capitalization reinforces the weak buying power reflected on the chart.
XRP Price Analysis: One-Day Chart
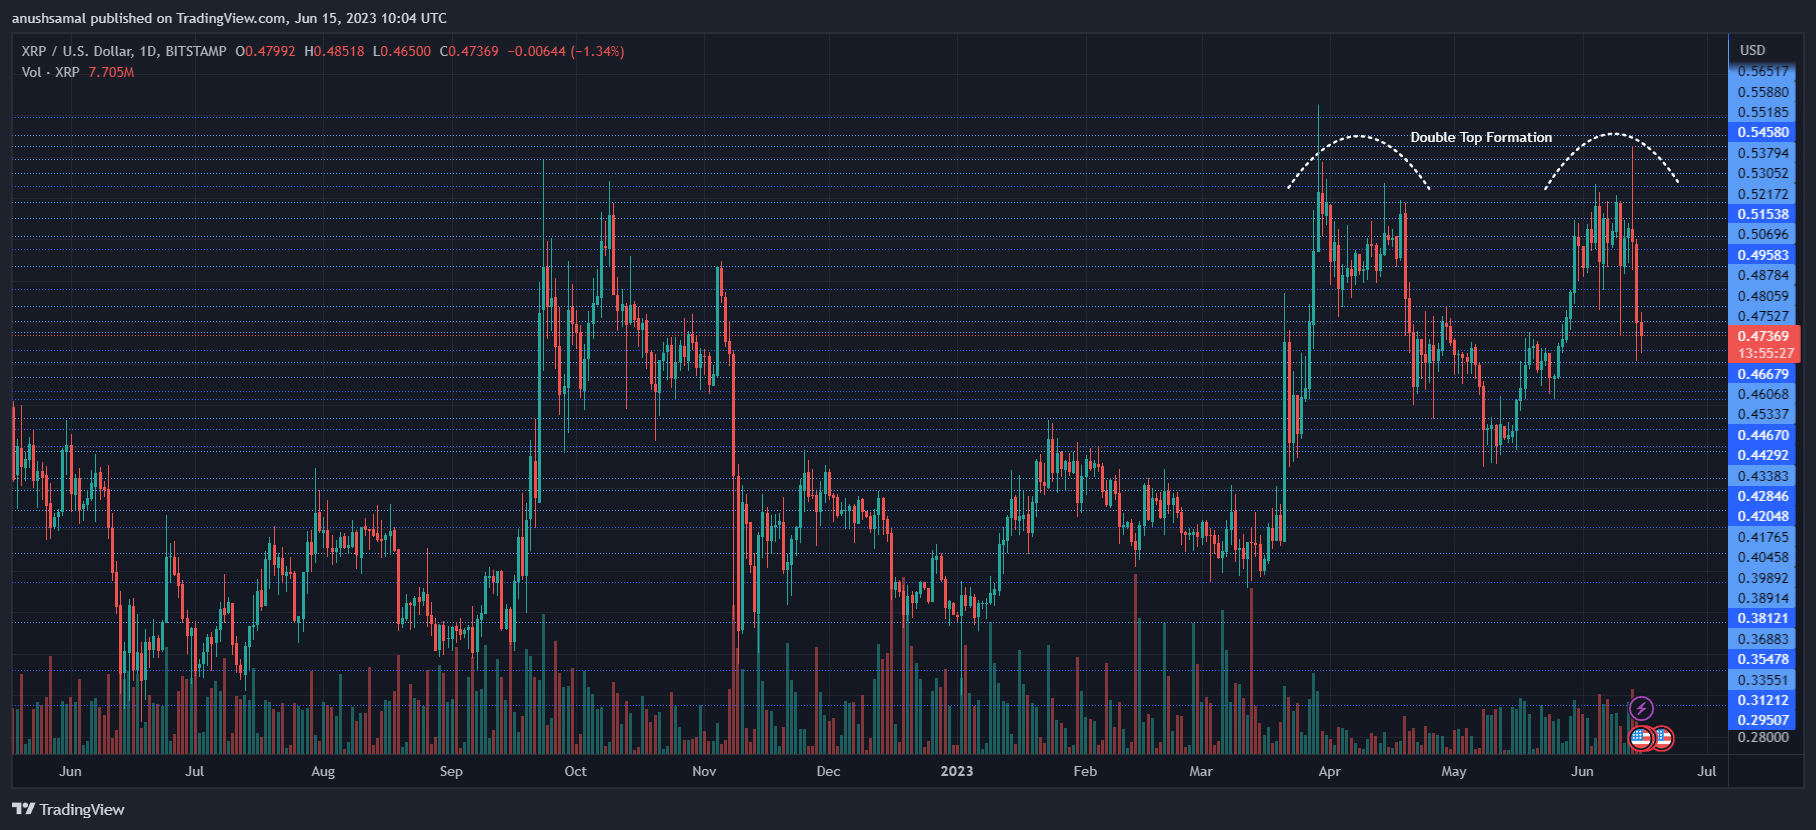
As of the time of writing, the altcoin XRP was trading at $0.47. Following the rejection of the bulls at $0.50, XRP has been experiencing a downward trend.
The coin faced resistance at $0.50, and it is anticipated that it may encounter even stronger resistance at $0.55. If the altcoin fails to surpass the $0.55 mark, it will likely dip to its local support level of $0.46 and potentially further down to $0.43.
Moreover, the altcoin has formed a bearish double-top pattern, indicating a potential reversal in its price trend as it moves downward on the chart. The trading volume of XRP has also declined in the last session, suggesting that sellers have taken control of the asset.
Technical Analysis
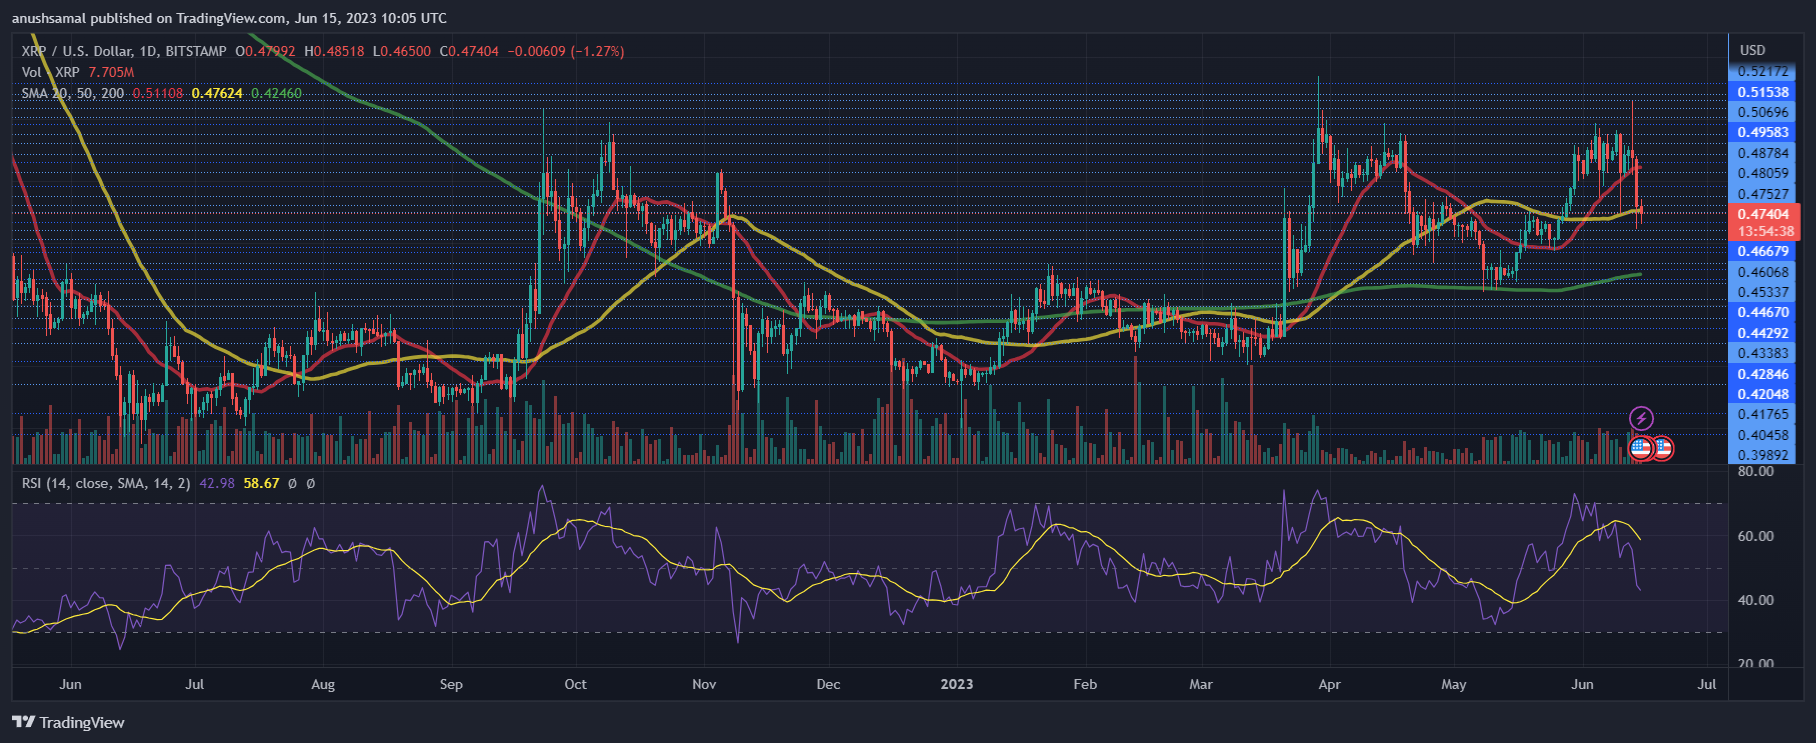
During the majority of this month, XRP witnessed a decline in demand. This was reflected by the Relative Strength Index (RSI) falling below the half-line, indicating that sellers had taken control of the asset.
Additionally, XRP fell below the 20-Simple Moving Average (SMA), suggesting low demand and indicating that sellers were driving the price momentum in the market.
However, if the altcoin trades near the $0.50 price mark, it can potentially bring the price back above the 20-SMA line. This would essentially indicate a resurgence in demand for the asset.
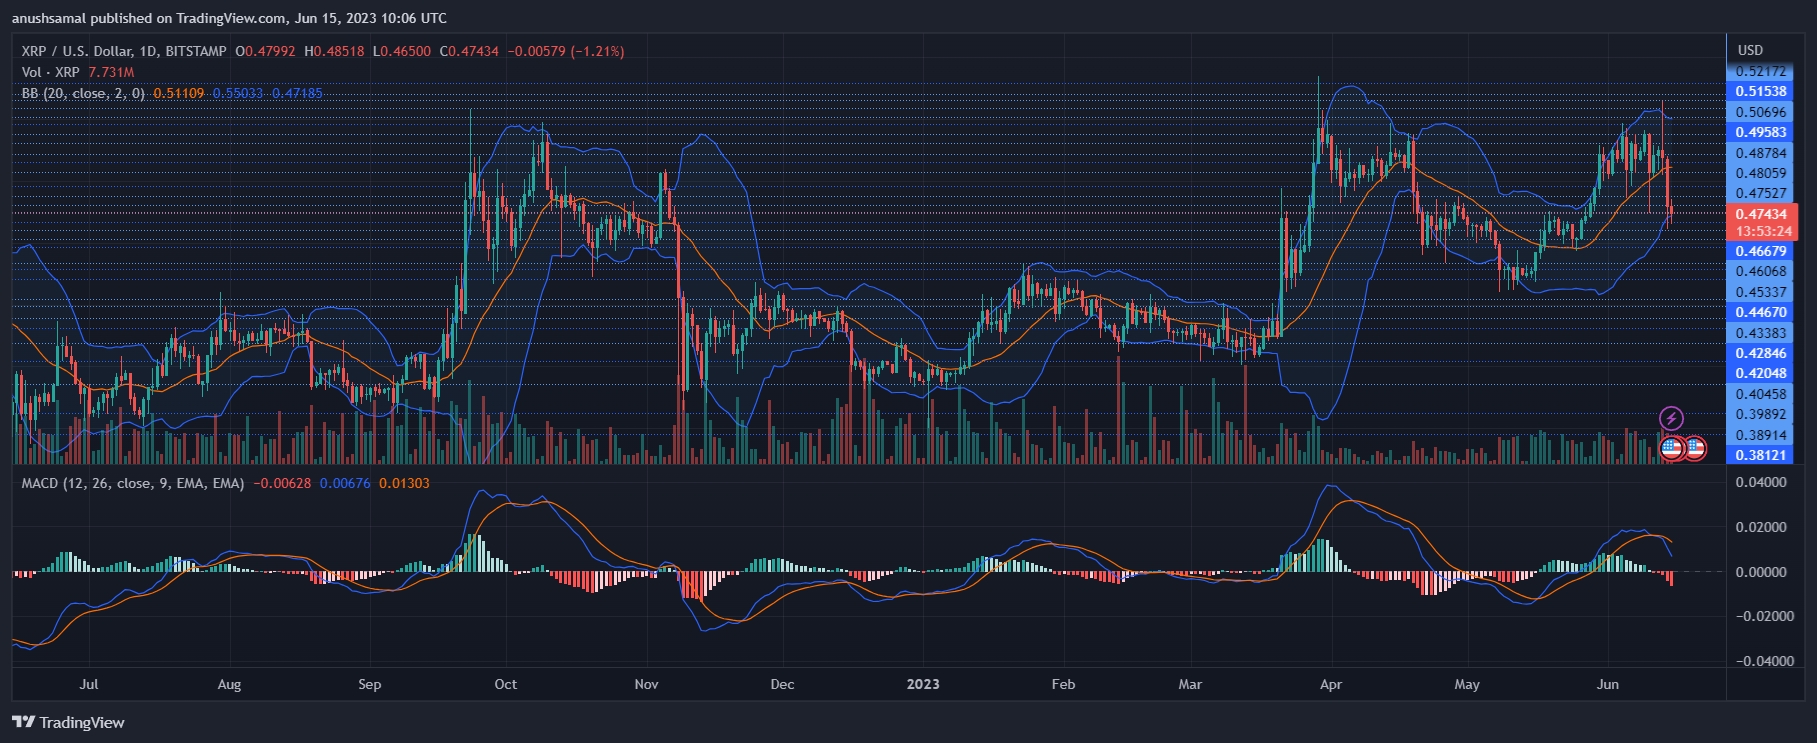
In addition to the mentioned technical indicators, other signals on the chart for the altcoin indicate selling pressure. The Moving Average Convergence Divergence (MACD) formed red histograms, signalling sell signals for the altcoin and indicating a bearish sentiment in the market.
Related Reading: Ethereum Bears Set Their Sights On Next Downside Target If $1,700 Support Breaks
Furthermore, the Bollinger Bands have widened, indicating increased volatility and potential price fluctuations for the altcoin in the upcoming trading sessions. This suggests that the price of XRP may experience significant changes and unpredictability in the near term.
Featured Image From UnSplash, Charts From TradingView.com
Source link


Bitcoin CME Futures BTC1 front month continuous contract price action closes over the weekend, making Friday evening the closing bell for the week. This Friday’s close saw price recover above a crucial level that in the past led to a bullish impulse in crypto. Here is a closer look at why bulls could be ready to charge in the coming weeks.
Using BTC CME Futures As A Crypto Crystal Ball
Large institutional traders don’t just trade spot BTCUSD, nor do they trade on Binance, ByBit, or another crypto platform. When they want to speculate and trade using derivatives contracts, they look to the Chicago Mercantile Exchange, better known as CME Group.
Unlike the 24/7, always-on crypto market, CME Group charts close down for the weekend and holidays much like stocks. Due to this behavior, the chart often features gaps that don’t appear on standard BTCUSD price charts. Discrepancies between BTC CME Futures charts and BTCUSD charts can lead to fakeouts and shakeouts.
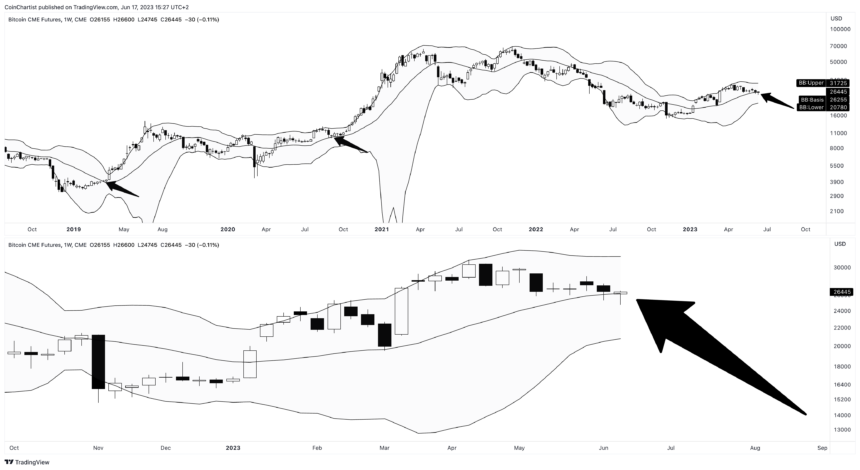
Because Bitcoin CME Futures does stop on Friday for the weekend, it also can provide early clues as to how spot price charts might close on Sunday night. In this case, BTC Futures has reclaimed the Bollinger Band basis line, often referred to as the “mid-BB”.
Is the third time the charm? | BTCUSD on TradingView.com
Bitcoin Price Recovers Above The Bollinger Band Basis Line
The basis line on the Bollinger Bands is a 20-period simple moving average. The tool’s creator, John Bollinger, then adds an upper and lower band set at two standard deviations of the SMA. This causes the bands to expand and contract with market volatility.
Like any moving average, it can act as dynamic support and resistance, holding up price action or preventing it from pushing along further. Following this Friday’s BTC Futures weekly close, Bitcoin has made it back above the mid-BB, possibly confirming it as support.
In the upper portion of the chart above, Bitcoin goes on an impulsive uptrend after holding above the basis line in 2019 and 2020. The lower portion depicts a closer look at this latest weekly close. Unless there is a massive collapse before Sunday night, BTCUSD technicals should follow suit. And if history repeats, a bull run could follow.
Is Bitcoin ready for a strong rally higher after reclaiming the key level as support? This chart was featured in issue #8 of CoinChartist (VIP) alongside a dozen other exclusive crypto charts. Click here to learn more.
Source link


The application by BlackRock, the world’s largest asset manager, for approval of a Bitcoin spot ETF with the US Securities and Exchange Commission (SEC) is the biggest story in the crypto market today. Numerous experts are extremely optimistic that an approval of the first Bitcoin spot ETF in the US will be a massively bullish event, attracting huge amounts of new capital and triggering a new bull run.
But where does this theory come from? Bitcoin is often referred to as the digital gold of the 21st century, so it’s an obvious choice to look at the history of gold and the first gold based spot ETF.
Why The BlackRock Bitcoin ETF Would Be So Bullish
The first thing to note is that BlackRock applied for a spot ETF and not a Futures ETF. The SEC has already approved a number of Bitcoin Futures ETFs that hold Bitcoin futures contracts on the CME. These are currently traded on the US equity markets, but have relatively low popularity. And this has its reasons, first and foremost the so-called “drag”, as Scimitar Capital explains.
Drag refers to the underperformance of a fund that attempts to replicate the return of a particular underlying asset and is a long-term result of regular portfolio rebalancing. To track the spot price, BITO, the largest bitcoin futures ETF, holds 2/3 in the front-month future and 1/3 in the following month.
However, this “rolling” is costly because of transaction fees, slippage and because futures for the last month are usually traded at a premium over the first month in BTC (“contango”). For this reason, futures ETFs are not a good investment for retail traders in the long run and are therefore unpopular.
A Bitcoin spot ETF does not have these disadvantages. “This is the reason why physically backed ETFs like GLD and IAU for gold have a combined 90B of AUM whereas futures backed ones like BITO and USO have a paltry 1.6B,” Scimitar Capital says.
The first gold ETF, the SPDR Gold Trust ETF (GLD), was listed on the NYSE on November 15, 2004 and revolutionized gold trading. Before GLD came on the market, it was possible to invest in gold in the form of bars, coins, certificates and shares of gold mining companies.
The exchange-traded fund made investing in precious metals a no-brainer and eliminated the problems of shipping and vaults. The same revolution could be coming to Bitcoin by a Bitcoin spot ETF. Retail investors could hold Bitcoin long-term through the ETF without worrying about custody and private keys.
And the revolution in gold also made itself felt in the price. While the price of gold was still below $450 per ounce in November 2004, gold saw a meteoric rise in the years that followed.
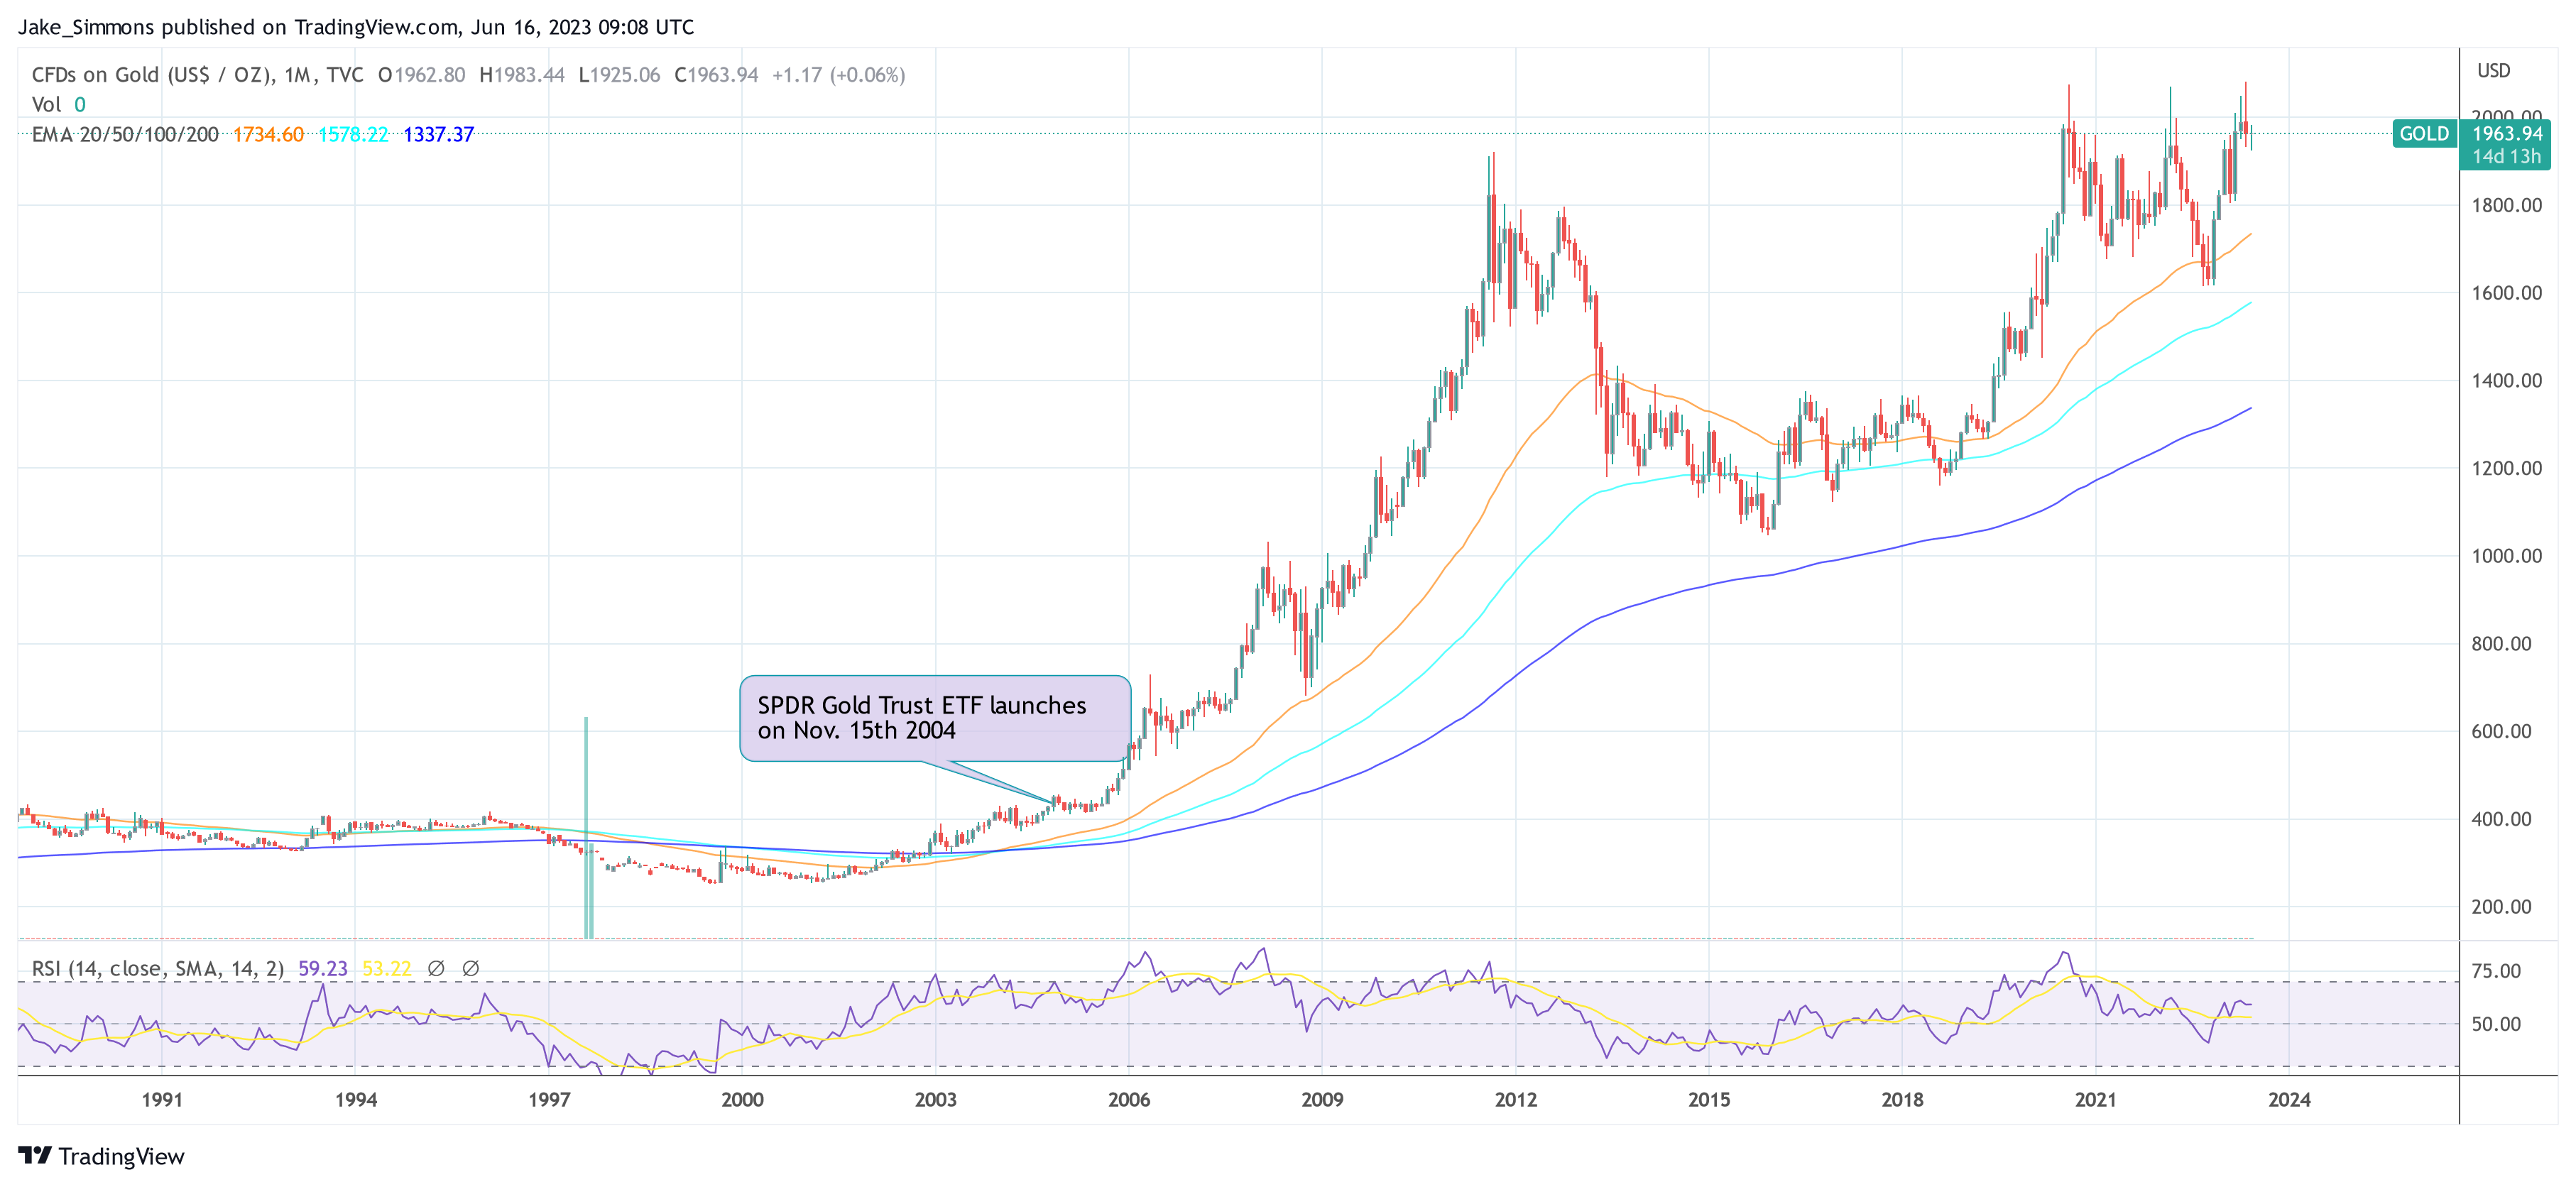
In September 2011, less than seven years after the launch, gold was trading at $1920 per ounce. Many economic factors have influenced the price of gold, but the launch of ETFs certainly played an influential role in attracting global institutional funds to the market.
The digital gold of the 21st century, Bitcoin, may yet see this price explosion if history repeats itself.
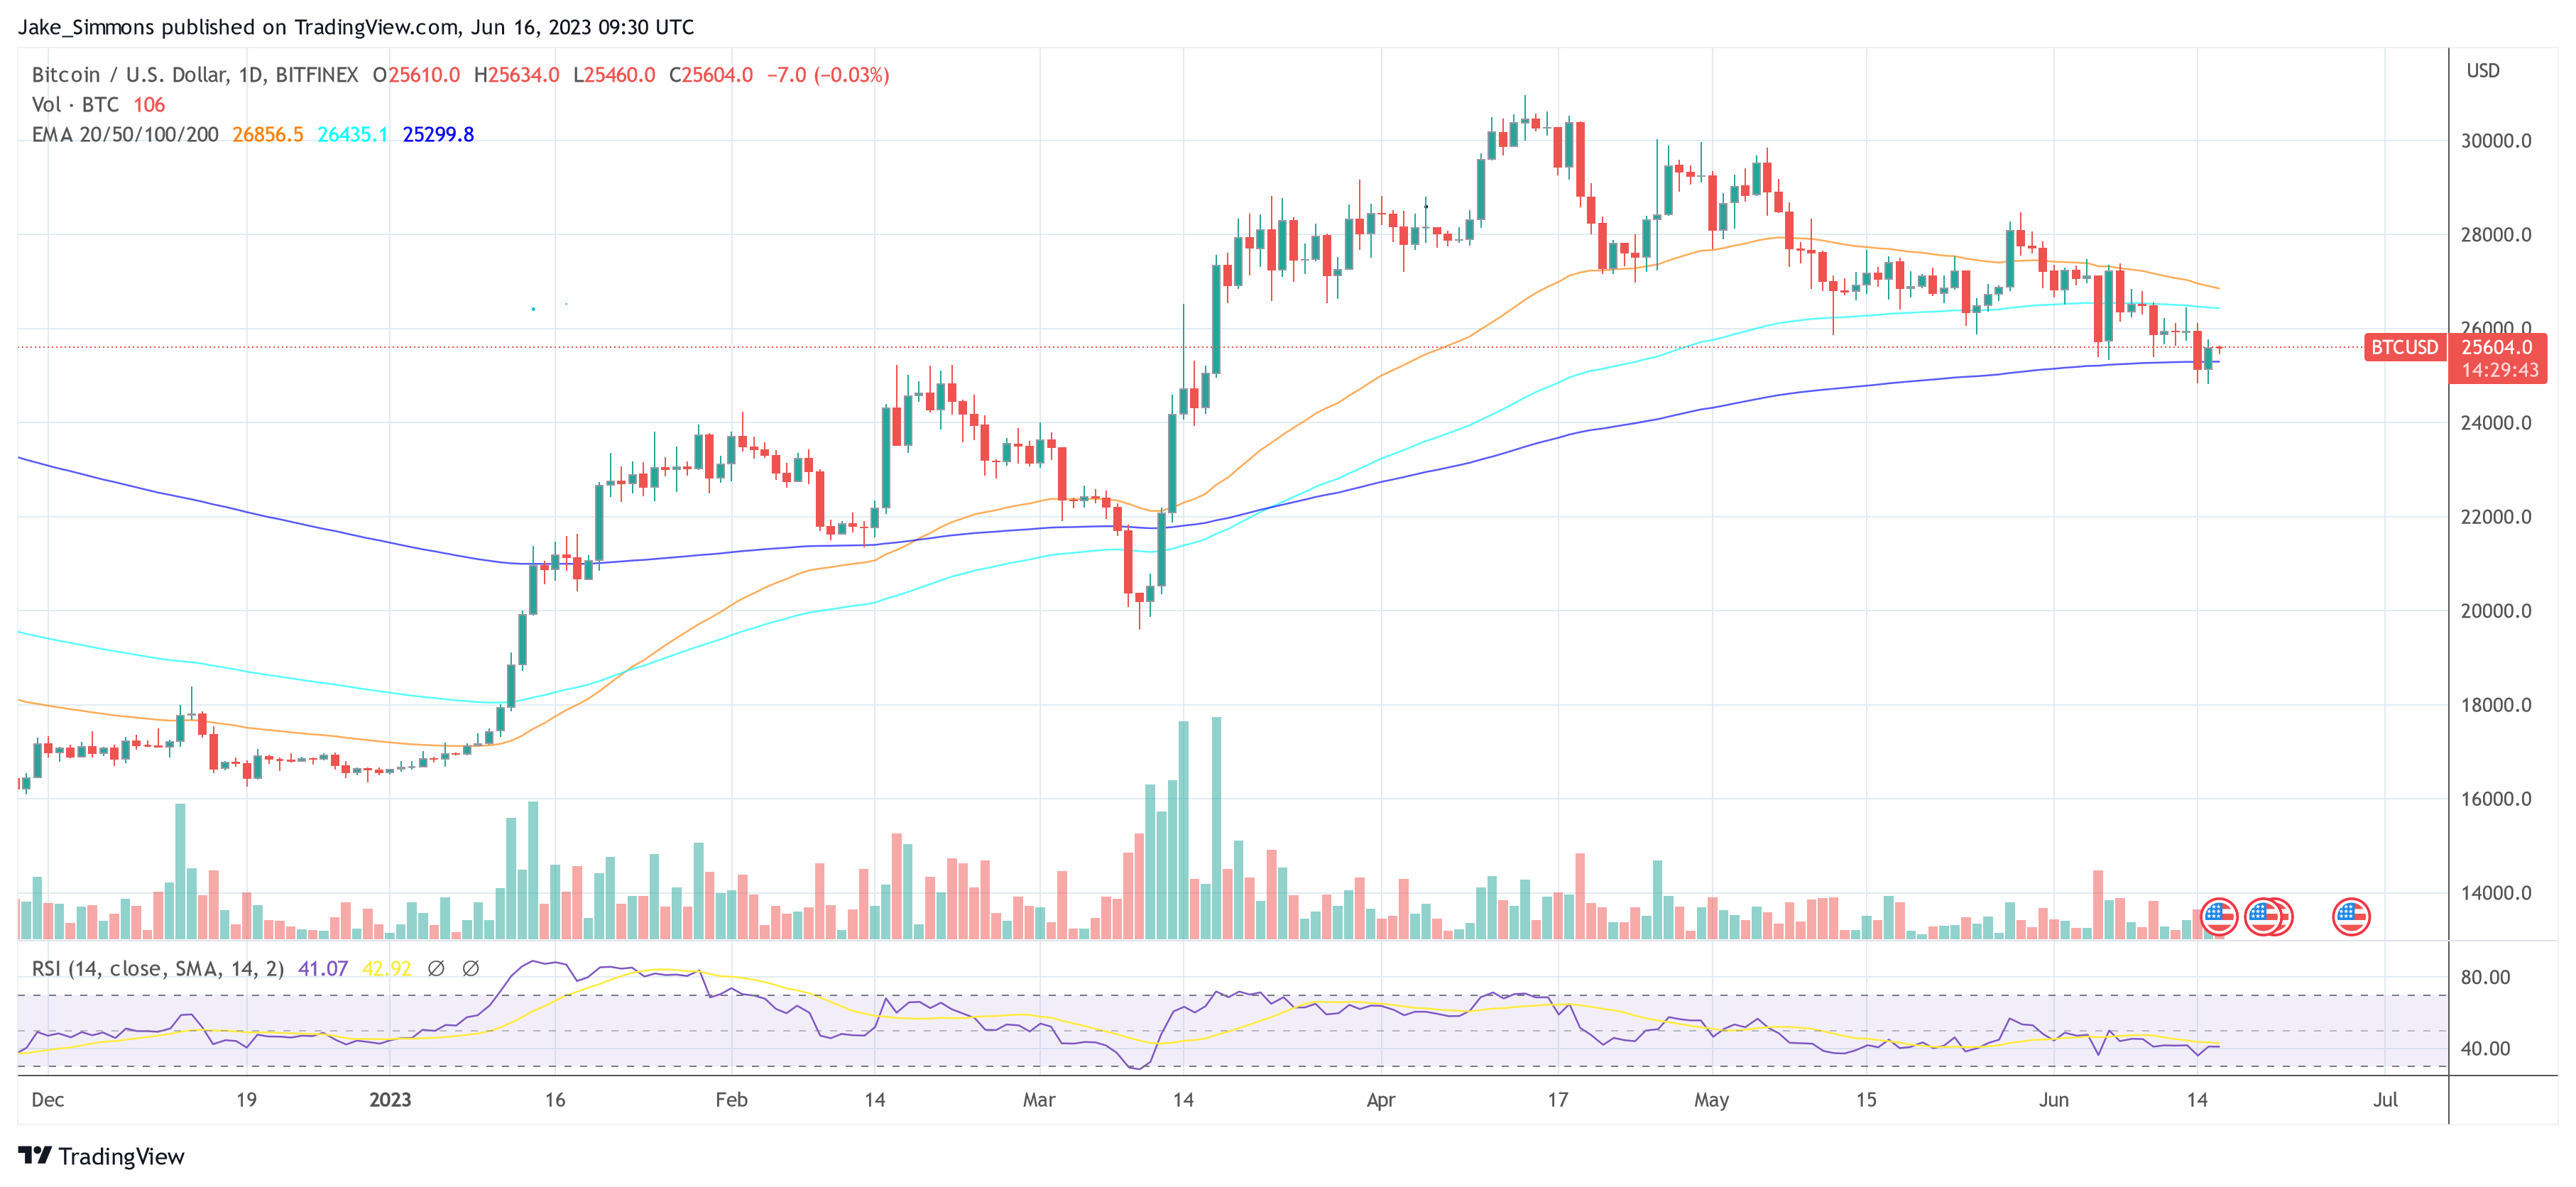
At press time, BTC traded at $25,604, reclaiming the 200-day EMA (blue line).
Featured image from iStock, chart from TradingView.com
Source link

Mango Markets exploiter behind alleged $116M theft will stand trial in December

Bitcoin price eyes $26K ‘acceleration’ zone as Binance fears fade

Price analysis 6/16: BTC, ETH, BNB, XRP, ADA, DOGE, SOL, MATIC, LTC, DOT

Gary Gensler’s job at risk, BlackRock’s first spot Bitcoin ETF…

BUSD falls to fourth position among stablecoins

Crypto outflows surge, a16z’s UK office, and the silent altcoins ban

Bitcoin Recovers Above Critical Level, Why Bulls Could Be Ready To Charge

The Great Battle of Asset Classification – Blockchain News, Opinion, TV and Jobs

3 key Ether price metrics point to growing resistance at the $1,750 level

Binance Coin (BNB) Faces Sideways Movement, Bears Threaten Further Sell-Off

US court approves SEC-Binance.US agreement

Polygon (MATIC) Witnesses High Volatility Amid Positive Developments

Meta’s new ‘Voicebox’ AI is a text-to-speech tool that learns like ChatGPT

ZachXBT Slapped With Defamation Lawsuit For MachiBigBrother Exposé

Tether responds to account deactivation controversy, raises compliance checks

Judge rules LBRY video platform’s token is a security in case brought by the US SEC

Silvergate Capital’s crypto-to-fiat transfers decrease by $50B compared to Q3 2021

Will the Bitcoin mining industry collapse? Analysts explain why crisis is really opportunity

Exchange Outflows Shows Bitcoin, Ethereum Accumulation Trend Continues

Bitcoin Dropped Below 2017 All-Time-High but Could Sellers be Getting Exhausted? – Blockchain News, Opinion, TV and Jobs
BNM DAO Token Airdrop

What does the Coinbase Premium Gap Tell us about Investor Activity? – Blockchain News, Opinion, TV and Jobs
Fed policy and crumbling market sentiment could send the total crypto market cap back under $1T
New Minting Services

Can Cardano’s July hard fork prevent ADA price from plunging 60%?

Friends or Enemies? – Blockchain News, Opinion, TV and Jobs
SEC’s Chairman Gensler Takes Aggressive Stance on Tokens – Blockchain News, Opinion, TV and Jobs

LUNA2 Recovers 70% In Nine Days From Historic Lows

Enjoy frictionless crypto purchases with Apple Pay and Google Pay | by Jim | @blockchain | Jun, 2022
A String of 200 ‘Sleeping Bitcoins’ From 2010 Worth $4.27 Million Moved on Friday
-
 SEC7 months ago
Judge rules LBRY video platform’s token is a security in case brought by the US SEC
-
 Banking8 months ago
Silvergate Capital’s crypto-to-fiat transfers decrease by $50B compared to Q3 2021
-
 Antminer11 months ago
Will the Bitcoin mining industry collapse? Analysts explain why crisis is really opportunity
-
 Bitcoin8 months ago
Exchange Outflows Shows Bitcoin, Ethereum Accumulation Trend Continues
-
 Altcoins12 months ago
Bitcoin Dropped Below 2017 All-Time-High but Could Sellers be Getting Exhausted? – Blockchain News, Opinion, TV and Jobs
-
Uncategorized1 year ago
BNM DAO Token Airdrop
-
 Binance11 months ago
What does the Coinbase Premium Gap Tell us about Investor Activity? – Blockchain News, Opinion, TV and Jobs
-
 Asia11 months ago
Fed policy and crumbling market sentiment could send the total crypto market cap back under $1T