Connect with us

Bitcoin

Bitcoin Bears Brace For The 50-Month MA Retest, Is A Rug Pull Imminent?

Published

on


Over the last 24 hours, Bitcoin (BTC), the largest cryptocurrency in the market by capitalization, has again failed to consolidate above the $27,000 level. This key resistance was lost at the beginning of the downtrend on May 8th and has not been breached. Additionally, the upper resistance level placed at $27,500 has also proven to be a challenge for BTC, as it has been unable to surpass it.

According to the crypto analysis firm Material Indicators, the crypto market continues to be stimulated by the fear, uncertainty, and doubt (FUD) surrounding the industry. With thin bid liquidity, Bitcoin has been retesting the 200-Week Moving Average (MA).

Bitcoin Faces Critical Test, Will The 200-Week MA Hold?

According to Material Indicators, If the 200-Week MA does not hold, another retest of the 50-Month MA might be. Material Indicators suggest that if this happens, the liquidity and sentiment at the 50-Month MA will be stronger, potentially leading to a bullish market reversal.

However, it is important to note that a “rug pull” at $25,000 – a sudden and significant drop in BTC’s price – could lead to a bearish market and further retest of the lower levels of $24,000 and $23,000.

BTC’s downtrend continuation on the 1-day chart. Source: BTCUSDT on TradingView.com

For the bulls, it is crucial to maintain control of the $27,000 level and push BTC’s price above the next significant resistance at $27,500. Doing so would allow the cryptocurrency to make another attempt at reaching the key psychological level of $30,000, which it has not achieved since April 19th.

On the same note, according to Baro Virtual, a Crypto Quant author, the leverage ratio is overheating, potentially leading to a dip in BTC’s price to $24,000.

The leverage ratio refers to the borrowed funds traders use to invest in BTC. When the leverage ratio increases, traders take on more debt to invest in the cryptocurrency. This can lead to a higher level of risk in the market, as a sudden drop in BTC’s price could trigger a significant amount of selling, resulting in a dip in price.

BTC’s Bullish Engulfing Pattern Signals Buying Opportunities

According to CJ, a cryptocurrency trader, there are several points that he is leaning into which could potentially provide opportunities for buying BTC.

CJ notes that BTC has experienced a range of low deviation and reclaim and a daily bullish engulfing pattern. These indicators suggest that any dips into the FVG (fair value gap) are buying opportunities, with a target of $29,000-$30,000 liquidity. However, a close below $26,100 would be bearish for the cryptocurrency.

Bitcoin’s recent price movements have left traders and investors unsure of what to expect in the near term. While the cryptocurrency initially showed a bullish reaction to the fair value gap, with a bullish 4-hour candle, it is now retracing.

It remains to be seen whether BTC can bounce back once again from its 200-week Moving Average or if a sudden and significant drop in price will push BTC into a new price regime and visit the lower levels.

Despite the uncertainty in the market, BTC is currently trading above key levels, and it needs to close above $26,000 to expect a further continuation of the uptrend. BTC’s gains in the past 24 hours have narrowed to only 0.8% after a recovery of 8% in the last few days.

Featured image from iStock, chart from TradingView.com


Source link

Bitcoin

Bitcoin Market Dominance Peaks In Nearly Two Years, Here’s Why

Published

on

By


Amid the ongoing crypto regulatory uncertainty, Bitcoin’s market dominance has surged to its highest level since July 2021, suggesting a shift in the sentiments of traders and investors towards the world’s pioneer and most substantial cryptocurrency, Bitcoin.

This milestone highlights the current volatility of the crypto market as it continues to grapple with regulatory uncertainty and the various factors that impact Bitcoin’s value.

The Resurgence Of Bitcoin Dominance

The latest data from TradingView reveals that Bitcoin dominance, defined as Bitcoin’s share of the total cryptocurrency market capitalization, has hit a high of 49.5%. This level has not been recorded since July 2021 when Bitcoin’s dominance touched a peak of over 48%.

Bitcoin (BTC) market dominance on TradingView.com

It is worth noting that earlier this year in April, Bitcoin’s dominance momentarily reached 48.83%, after which it fluctuated within a specific range.

However, the past week saw a notable increase in Bitcoin’s market dominance, correlating with the time when the US Securities and Exchange Commission (SEC) categorized numerous tokens as unregistered securities in its lawsuits against the world’s largest crypto exchanges – Binance and Coinbase.

Consequently, many of these tokens such as Cardano (ADA), Solana (SOL), and Binance Coin (BNB) have experienced significant price drops, while Bitcoin’s value has remained comparatively stable.

Market Influences And The Upcoming BTC Halving

The regulatory actions by the SEC underscore an environment of uncertainty that has had noticeable effects on the crypto market. Amid this backdrop, Bitcoin emerges as a sort of safe haven.

Micheal Saylor, a prominent Bitcoin advocate, echoed these sentiments in a recent interview with Bloomberg, predicting that: “the entire industry is kind of destined to be rationalized down to Bitcoin and a half a dozen to a dozen other proof-of-work tokens.”

Furthermore, anticipation around the upcoming Bitcoin halving event, slated for April or May 2024, could be a contributing factor to Bitcoin’s increasing dominance.

This quadrennial event reduces the reward for mining new Bitcoin blocks by half, effectively slowing the rate at which new Bitcoins are created to manage inflation and maintain their scarcity. The impending halving will result in a block reward decrease from 6.25 bitcoins to 3.125 bitcoins.

Notably, BTC has been in a downward trend in the past week. The largest crypto asset by market capitalization has recorded a bearish movement falling by nearly 5% in the past 7 days. However, over the past 24 hours, BTC has picked up an uptrend, seeing a 2.3% gain in its value.

Bitcoin (BTC)’s price moving sideways on the 4-hour chart. Source: BTC/USD on TradingView.com

Bitcoin currently has a market price of $25,515, at the time of writing after initially trading below that price range earlier this week. Meanwhile, Bitcoin’s trading volume has plunged over the past 24 hours from over $15 billion on Thursday to $7.7 billion at the time of writing indicating less trading activity.

Featured image from Unsplash, Chart from TradingView


Source link

Continue Reading

Bitcoin

Bitcoin Bullish Momentum Building: Expert Predicts Rise To $27,200

Published

on

By


Bitcoin has been on a rollercoaster ride recently, with sudden price drops and spikes keeping investors on their toes. Last week, the cryptocurrency failed to break through its $27,500 resistance level and dropped to a low of $24,700.

However, Bitcoin has again shown signs of regaining its bullish momentum, with a 5% increase in the last 24 hours and trading at $26,400 at the time of writing.

Many analysts have predicted a continuation of the uptrend in Bitcoin’s price, which has been ongoing since January 2023.

Bearish Momentum Fades As Bitcoin Retests $26,500

According to Glassnode co-founder Yan Allemann, the current stage in this trend is the retesting of the $26,200 level as bearish momentum fades.

Allemann believes that this is an important stage, as it will determine whether Bitcoin can break through its previous resistance and move toward the next target of $27,200

However, while Bitcoin is showing signs of regaining its bullish momentum, it’s important to recognize that it is still fragile at this level. Therefore, building confidence among investors is crucial to sustaining Bitcoin’s upward trend.

On a positive note, BlackRock’s recent application with the Securities and Exchange Commission (SEC) for its new exchange-traded fund (ETF) has given Bitcoin holders and bulls hope.

As reported by NewsBTC, the recent announcement of BlackRock’s Bitcoin exchange-traded fund has the potential to impact BTC’s price significantly. If approved, this ETF would enable a wider range of investors to gain exposure to Bitcoin, which could drive up demand and ultimately increase its price.

ETFs provide a convenient way for institutional investors to access Bitcoin, creating a new demand avenue for the cryptocurrency. This could increase buying pressure and a potential surge in Bitcoin’s price.

Potential BTC Reversal From Support

Bitcoin has recently bounced from its bullish trend and the top of its range, indicating that it still has some work to do before establishing a sustainable upward trend.

According to market analyst Crypto Con, one of the most accurate indicators of Bitcoin’s bullish or bearish momentum is the 140-day moving average (MA), which shows that BTC’s price is below this crucial level.

The 140DMA is a widely followed indicator in the cryptocurrency market, as it clearly signals whether Bitcoin is in a bullish or bearish phase.

When BTC’s price is above the 140DMA, it’s a bullish signal, indicating that the cryptocurrency will likely continue its upward trend. Conversely, when the price is below the 140DMA, it’s a bearish signal, suggesting that the cryptocurrency will likely experience a downward trend.

Bitcoin’s price is below the 140DMA, indicating that it’s in a bearish phase. However, Crypto Con hopes the cryptocurrency will experience a huge reversal from this support level, leading to a bearish fakeout of the 140DMA. This strong bullish signal could indicate that Bitcoin is ready to continue its upward trend.

As BlackRock’s potential Bitcoin ETF gains attention and BTC gradually regains its bullish momentum, investors are increasingly optimistic that Bitcoin’s bottom is already behind. There is a growing belief that the largest cryptocurrency in the market is poised to reach new annual highs in 2023 and possibly even surpass its all-time high.

However, for BTC to continue its upward trend, the cryptocurrency needs to maintain its current level of $26,000 throughout the weekend. A sustained price above this price mark could indicate that BTC is on track for a green week in the coming days.

Featured image from iStock, chart from TradingView.com


Source link

Continue Reading

Bitcoin

What Happens To Bitcoin Price If Spot ETF Is Approved?

Published

on

By


The application by BlackRock, the world’s largest asset manager, for approval of a Bitcoin spot ETF with the US Securities and Exchange Commission (SEC) is the biggest story in the crypto market today. Numerous experts are extremely optimistic that an approval of the first Bitcoin spot ETF in the US will be a massively bullish event, attracting huge amounts of new capital and triggering a new bull run.

But where does this theory come from? Bitcoin is often referred to as the digital gold of the 21st century, so it’s an obvious choice to look at the history of gold and the first gold based spot ETF.

Why The BlackRock Bitcoin ETF Would Be So Bullish

The first thing to note is that BlackRock applied for a spot ETF and not a Futures ETF. The SEC has already approved a number of Bitcoin Futures ETFs that hold Bitcoin futures contracts on the CME. These are currently traded on the US equity markets, but have relatively low popularity. And this has its reasons, first and foremost the so-called “drag”, as Scimitar Capital explains.

Drag refers to the underperformance of a fund that attempts to replicate the return of a particular underlying asset and is a long-term result of regular portfolio rebalancing. To track the spot price, BITO, the largest bitcoin futures ETF, holds 2/3 in the front-month future and 1/3 in the following month.

However, this “rolling” is costly because of transaction fees, slippage and because futures for the last month are usually traded at a premium over the first month in BTC (“contango”). For this reason, futures ETFs are not a good investment for retail traders in the long run and are therefore unpopular.

A Bitcoin spot ETF does not have these disadvantages. “This is the reason why physically backed ETFs like GLD and IAU for gold have a combined 90B of AUM whereas futures backed ones like BITO and USO have a paltry 1.6B,” Scimitar Capital says.

The first gold ETF, the SPDR Gold Trust ETF (GLD), was listed on the NYSE on November 15, 2004 and revolutionized gold trading. Before GLD came on the market, it was possible to invest in gold in the form of bars, coins, certificates and shares of gold mining companies.

The exchange-traded fund made investing in precious metals a no-brainer and eliminated the problems of shipping and vaults. The same revolution could be coming to Bitcoin by a Bitcoin spot ETF. Retail investors could hold Bitcoin long-term through the ETF without worrying about custody and private keys.

And the revolution in gold also made itself felt in the price. While the price of gold was still below $450 per ounce in November 2004, gold saw a meteoric rise in the years that followed.

Gold GLD price history
Gold price USD/ OZ, 1-month chart | Source: GOLD on TradingView.com

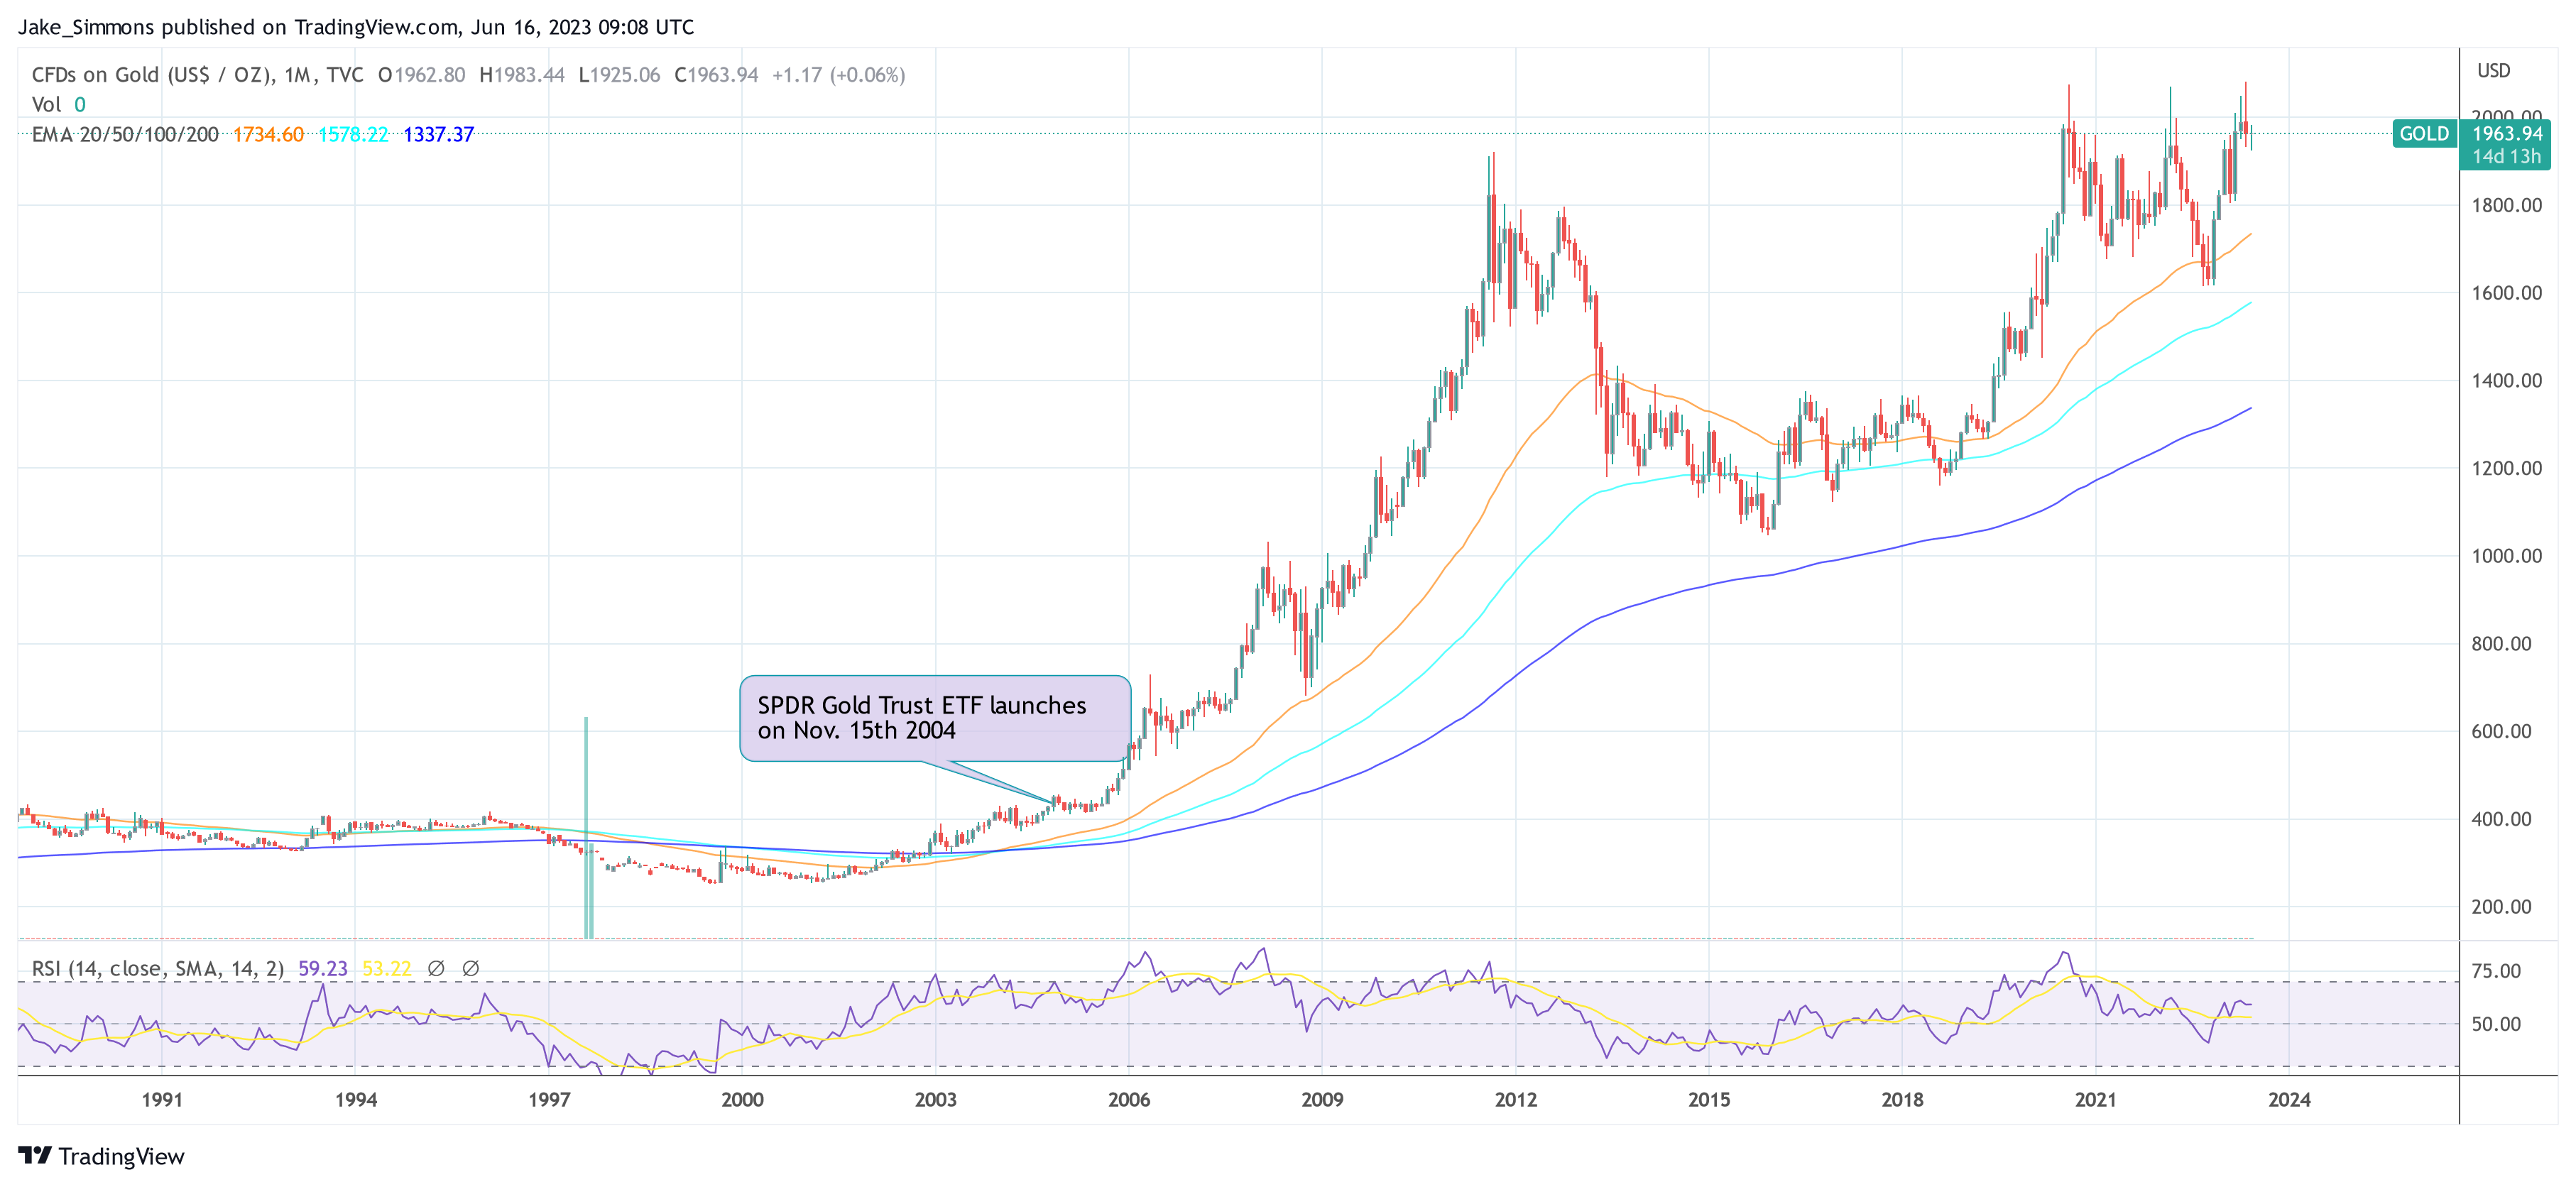
In September 2011, less than seven years after the launch, gold was trading at $1920 per ounce. Many economic factors have influenced the price of gold, but the launch of ETFs certainly played an influential role in attracting global institutional funds to the market.

The digital gold of the 21st century, Bitcoin, may yet see this price explosion if history repeats itself.

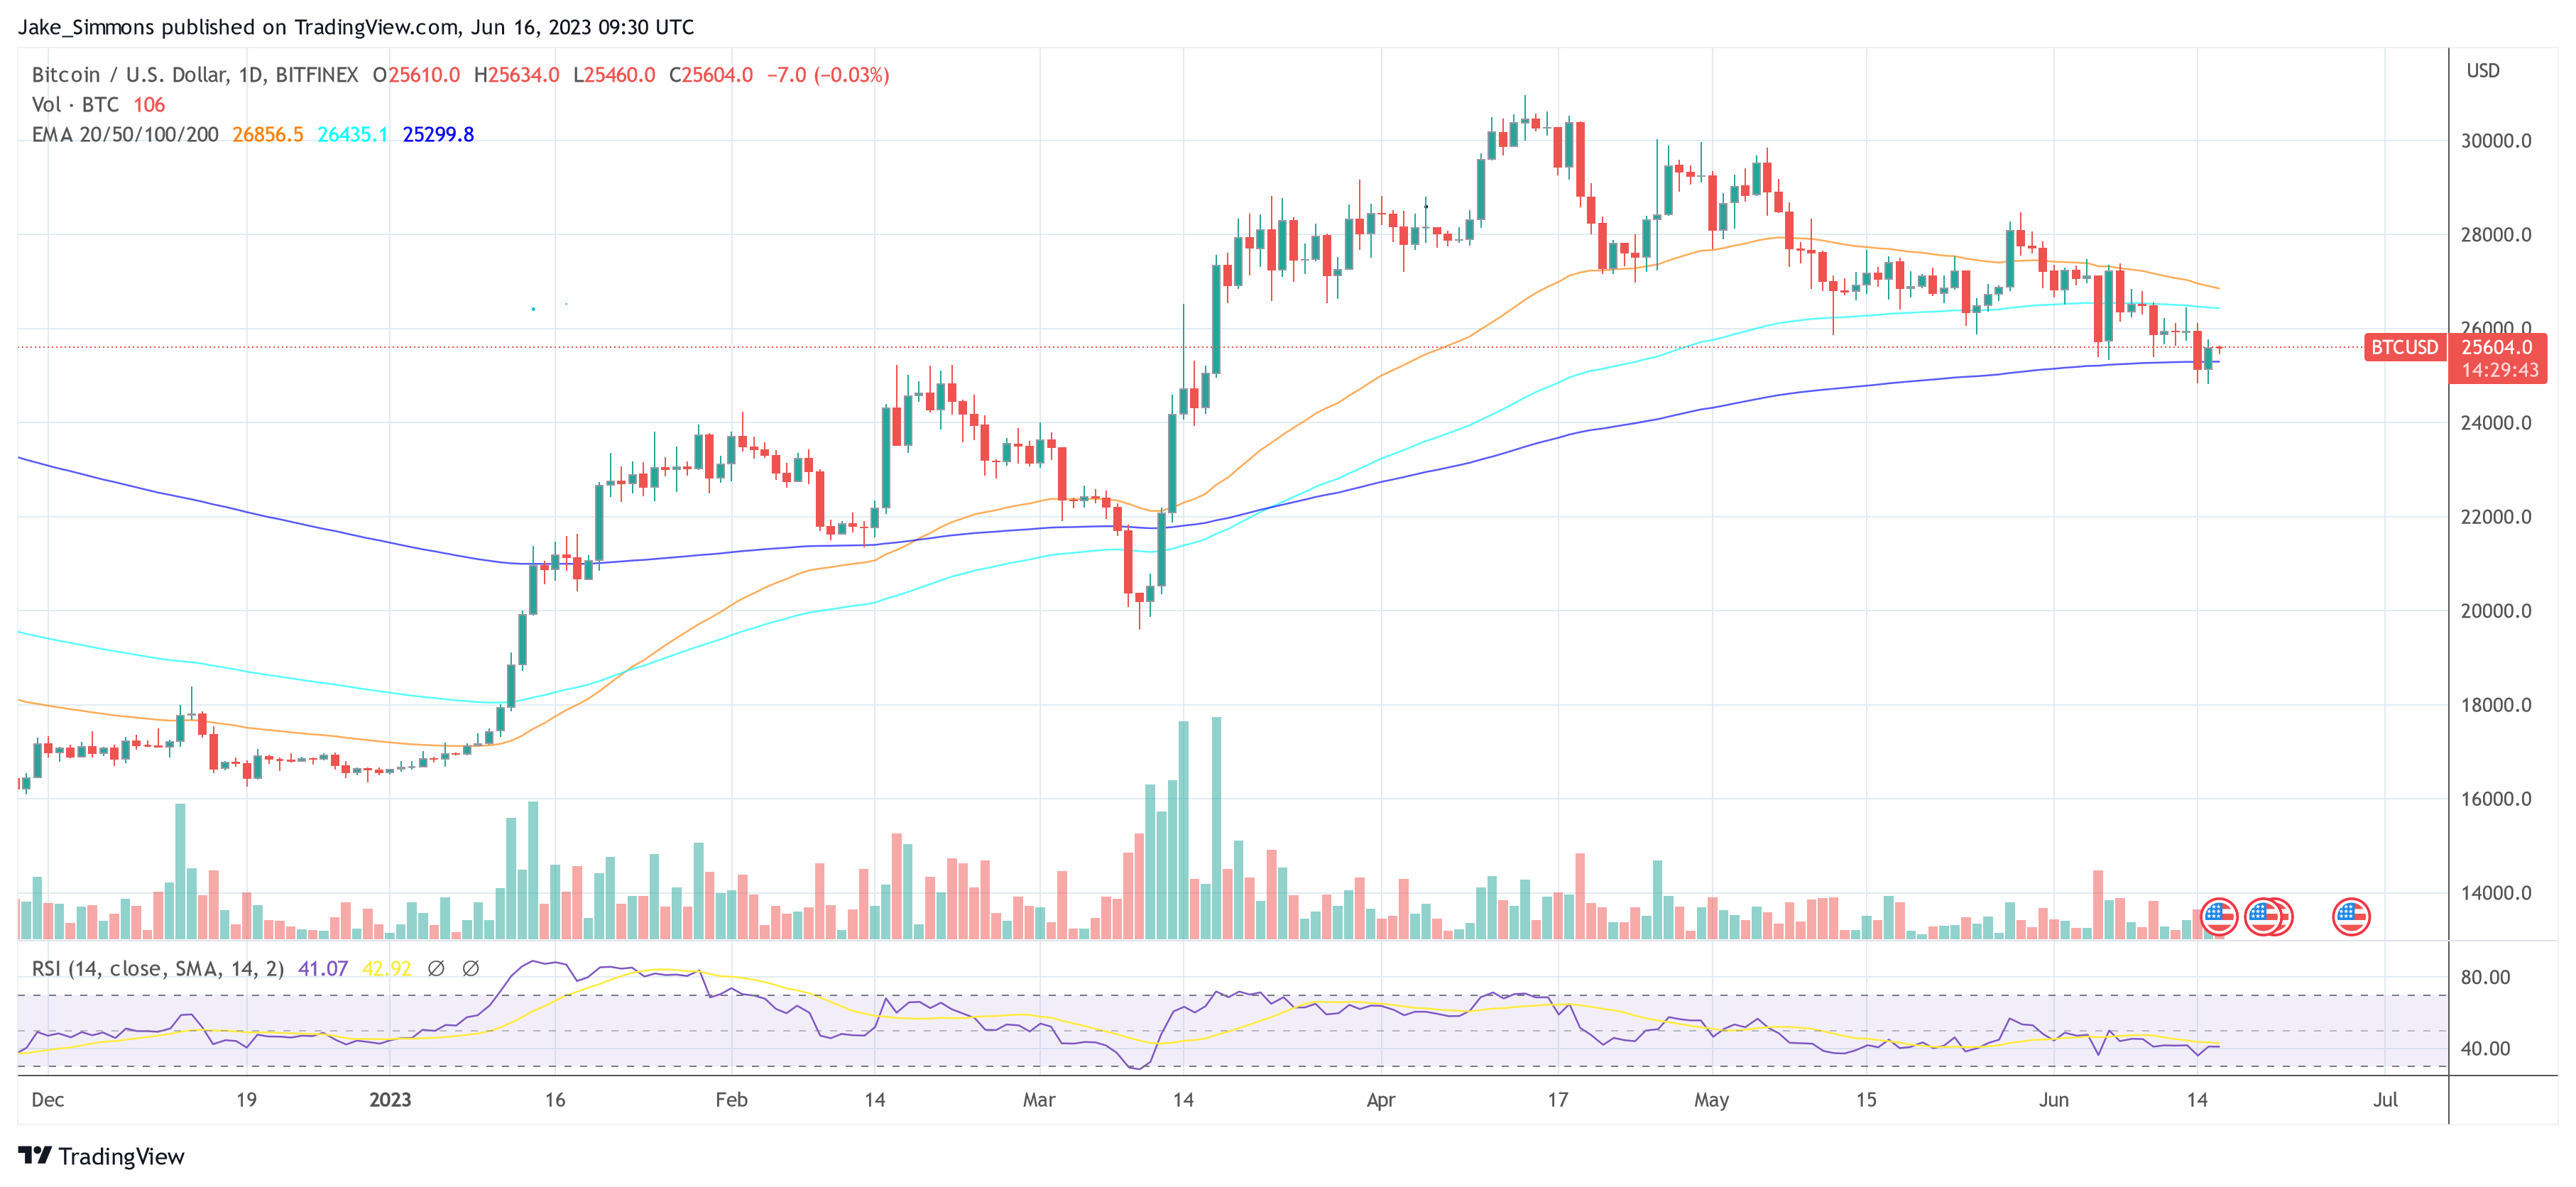
At press time, BTC traded at $25,604, reclaiming the 200-day EMA (blue line).

Bitcoin price
Bitcoin price reclaims 200-day EMA, 1-day chart | Source: BTCUSD on TradingView.com

Featured image from iStock, chart from TradingView.com


Source link

Continue Reading
Advertisement [ethereumads]
SEC7 months ago

Judge rules LBRY video platform’s token is a security in case brought by the US SEC

Antminer11 months ago

Will the Bitcoin mining industry collapse? Analysts explain why crisis is really opportunity

Banking8 months ago

Silvergate Capital’s crypto-to-fiat transfers decrease by $50B compared to Q3 2021

Bitcoin8 months ago

Exchange Outflows Shows Bitcoin, Ethereum Accumulation Trend Continues

Altcoins12 months ago

Bitcoin Dropped Below 2017 All-Time-High but Could Sellers be Getting Exhausted? – Blockchain News, Opinion, TV and Jobs

Uncategorized1 year ago

BNM DAO Token Airdrop

Binance11 months ago

What does the Coinbase Premium Gap Tell us about Investor Activity? – Blockchain News, Opinion, TV and Jobs

Asia11 months ago

Fed policy and crumbling market sentiment could send the total crypto market cap back under $1T

Uncategorized2 years ago

New Minting Services

ADA Price12 months ago

Can Cardano’s July hard fork prevent ADA price from plunging 60%?

Bitcoin miners10 months ago

Friends or Enemies? – Blockchain News, Opinion, TV and Jobs

Bitcoin4 months ago

SEC’s Chairman Gensler Takes Aggressive Stance on Tokens – Blockchain News, Opinion, TV and Jobs

CoinMarketCap12 months ago

LUNA2 Recovers 70% In Nine Days From Historic Lows

apple-pay12 months ago

Enjoy frictionless crypto purchases with Apple Pay and Google Pay | by Jim | @blockchain | Jun, 2022

Bitcoin miners12 months ago

A String of 200 ‘Sleeping Bitcoins’ From 2010 Worth $4.27 Million Moved on Friday

Trending