
analysis
4 signs the Bitcoin price rally could top out at $26K for now

Bitcoin (BTC) received a substantial boost this week as United States inflation levels for February were in line with market expectations. On March 14, the BTC/USD pair surged to a 2023 peak at $26,550 after the news.
But, while the macroeconomic conditions may currently favor risk-on buyers, certain on-chain and market indicators hint at a potential correction in the near term.
BTC flows back to exchanges as price rises
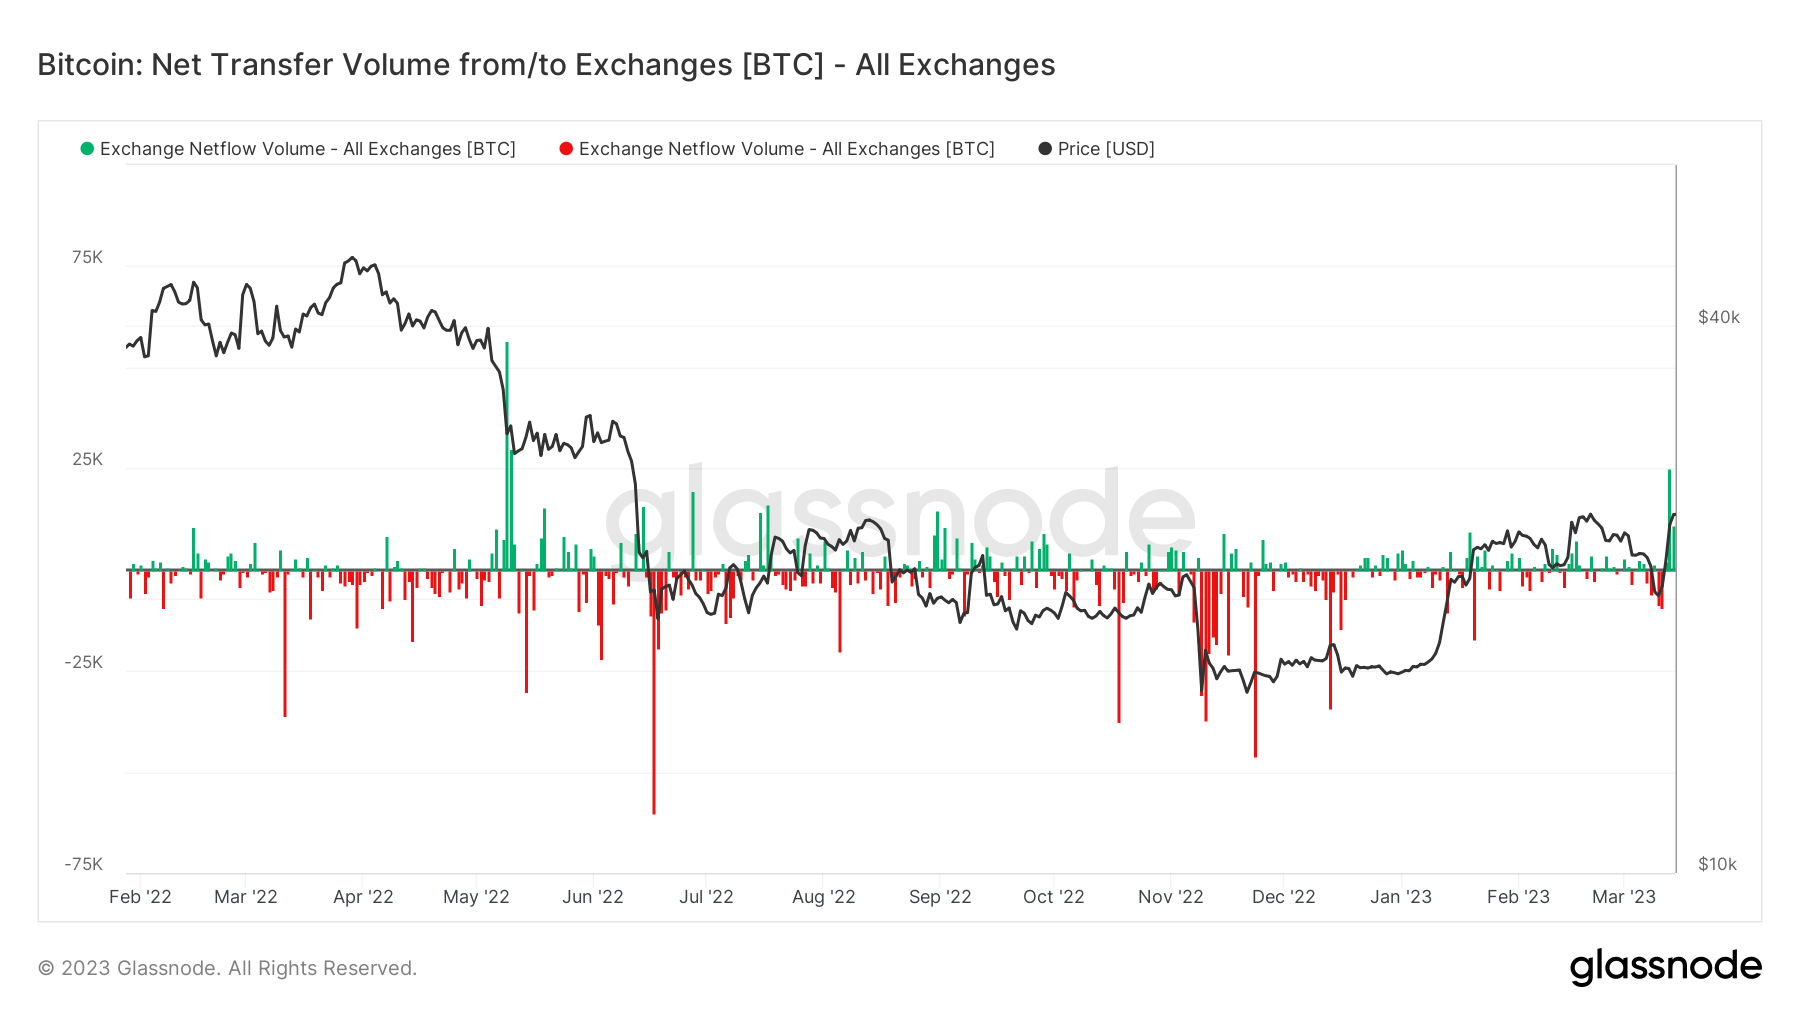
On March 13, Glassnode’s exchange flow data recorded the most significant inflow to exchanges since May 2022. This means more supply on exchanges and potentially higher selling pressure.
The coin days destroyed indicator, which measures the time-weighted transfers of Bitcoin, also shows a small spike, indicating that old hands are moving coins. The indicators might signal profit booking by long-term holders, which can lead to a correction.
Bitcoin funding rates, RSI jump
Moreover, the funding rate for Bitcoin perpetual swaps is also elevated with the latest Consumer Price Index print. In other words, more traders are betting on the upside with leveraged positions, increasing the risk of a correction.
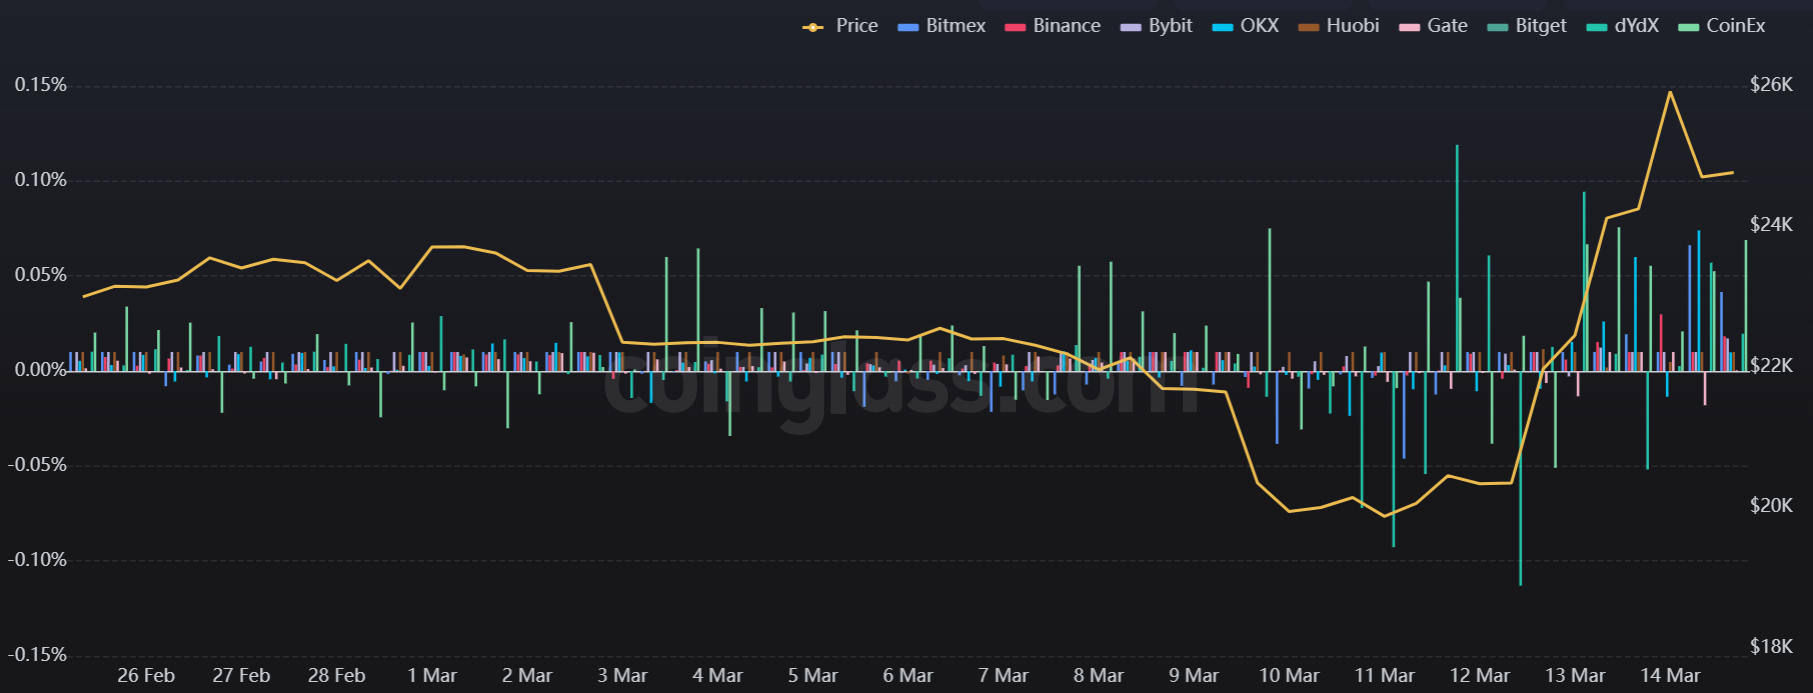
The sharp price movement has also recorded a significant spike in the Relative Strength Index (RSI), a technical momentum indicator, with a reading of as high as 82. This means that BTC/USD is generally considered “overbought” in the short term.
BTC vs. USD painting a bearish pattern
BTC price is currently forming a broadening wedge pattern, which depicts the heightened level of volatility. Both buyers and sellers are pushing the price beyond support and resistance levels, with the reversals coming quickly.
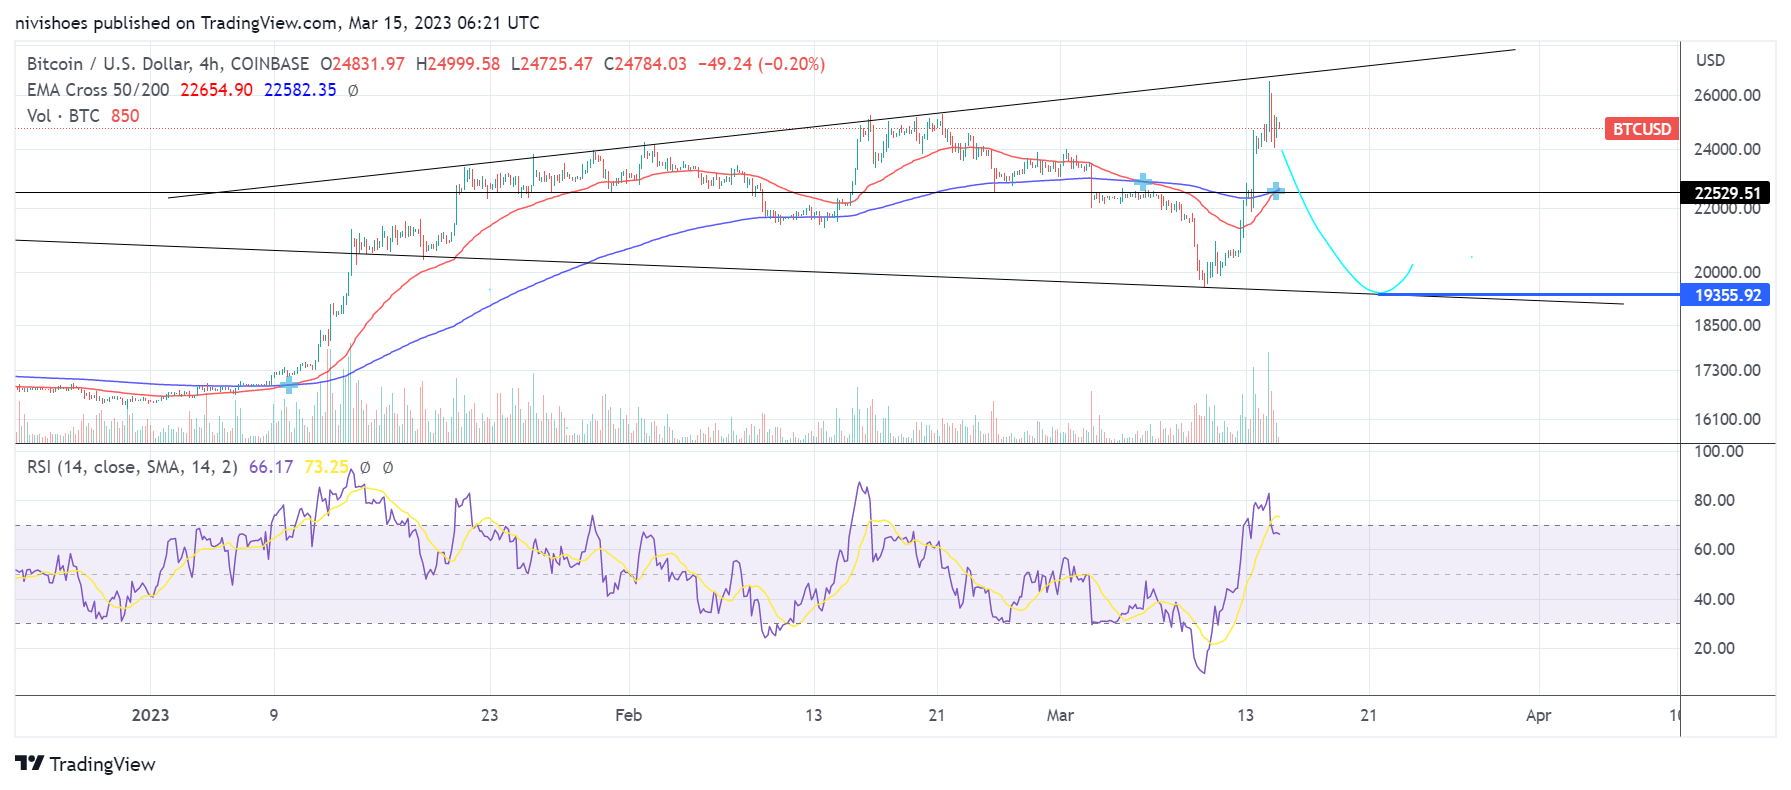
Buyers failed to stage a pattern breakout on March 14, and are now facing resistance at its ceiling of $26,700. At the same time, there is a chance that the price will correct back toward the bottom of the pattern, around $19,500, in the coming days.
On the contrary, if Bitcoin’s price breaks above the top trendline, the bulls will likely pile in to push the price toward $30,000. There are potentially welcome signs for the bulls that this could happen — namely in the BTC options and futures markets.
As Cointelegraph reported, there’s still room to run, as the indicators have yet to reach previous peak levels.
This article does not contain investment advice or recommendations. Every investment and trading move involves risk, and readers should conduct their own research when making a decision.
Source link


Bitcoin (BTC) continues with its sideways BTC price action under $27,000 on May 22 as the bulls and bears find it hard to break the stalemate.
Which way Bitcoin?
Notably, BTC price has fluctuated inside a narrowing ascending triangle range since May 11, defined by a horizontal resistance around $27,500 and a rising trendline support currently near $26,890.
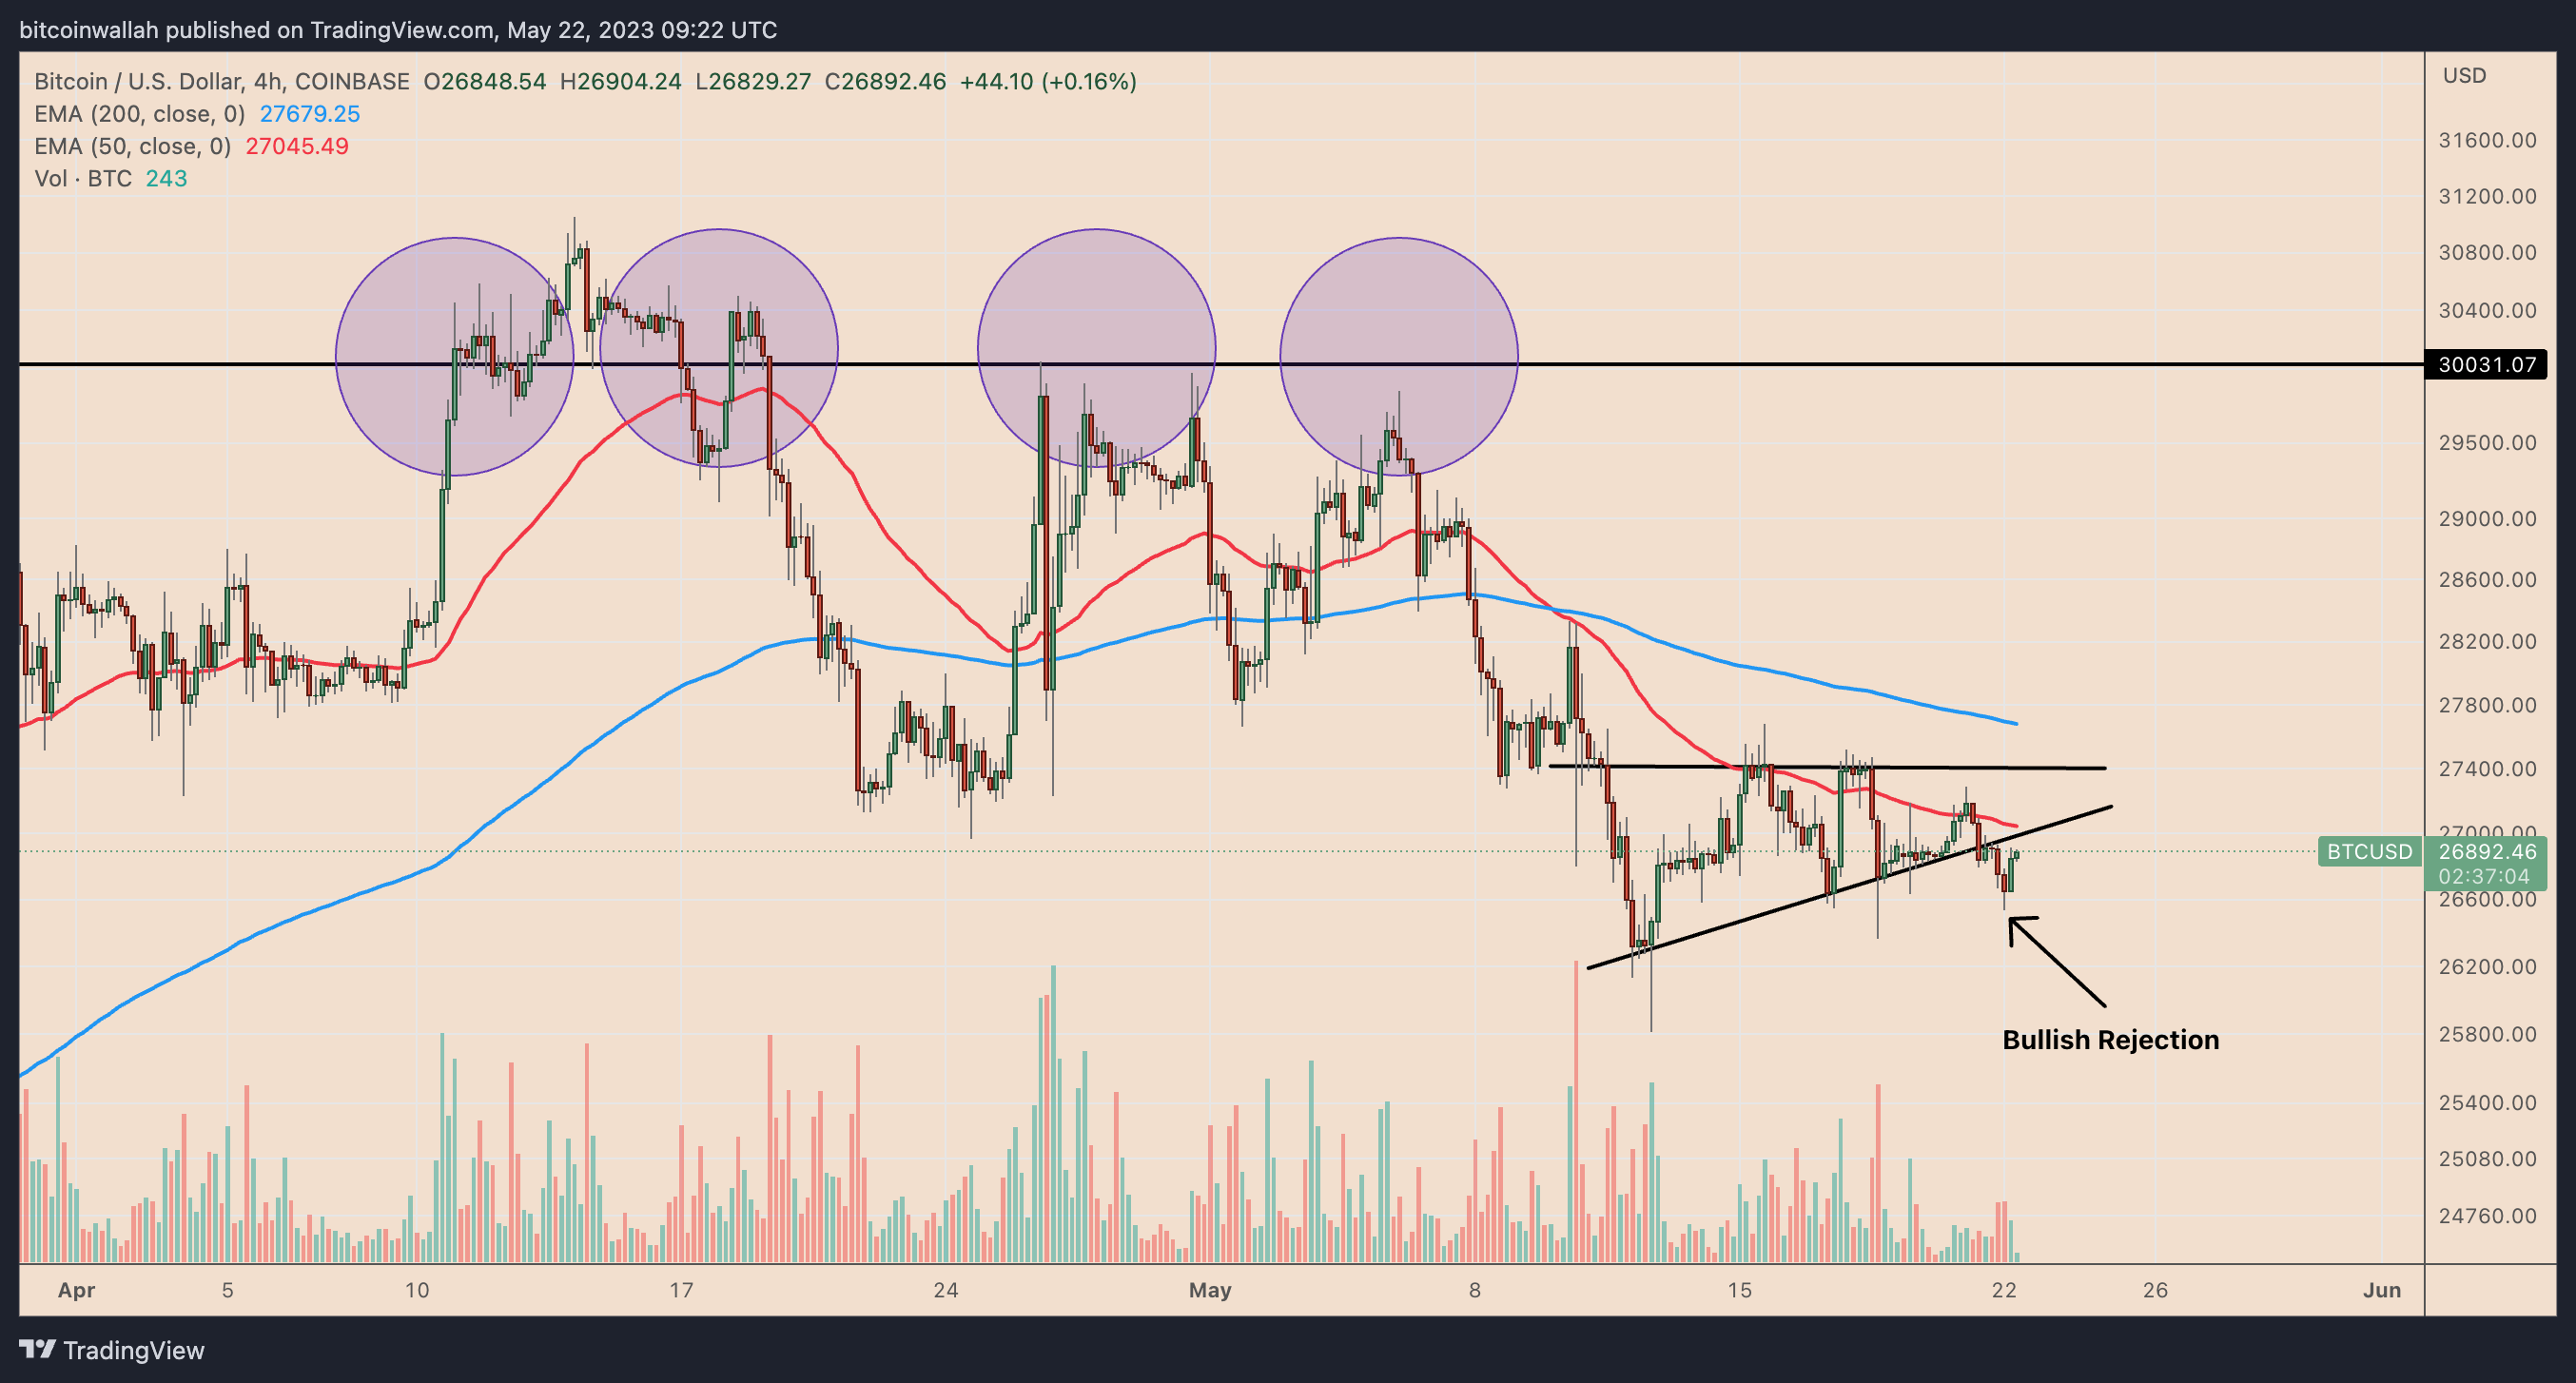
On May 22, Bitcoin dropped below the support trendline to around $26,550 but recovered quickly afterward to $26,900 — a bullish rejection. Meanwhile, the volumes were relatively lower, suggesting fewer traders participated in the intraday dump-and-pump move.
Overall, these technicals illustrate an ongoing bias conflict among traders. In other words, they are unsure about the direction of Bitcoin’s next price trend with the same amount of buyers and sellers — something that derivatives are also hinting at.
Why is BTC price not moving?
Flat price action in the Bitcoin market can precede periods of extreme price volatility, triggered by big events.
For instance, Bitcoin fluctuated in the $16,000-17,500 range between Nov. 9, 2022, and Jan. 10. 2023, right in the aftermath of the FTX crypto exchange’s collapse. The price attempted to break above and below the range on some days but failed to establish a recovery trend.
The market witnessed a similar flat trend after the sharp BTC price decline led by the collapse of Terra in May 2022. Notably, BTC/USD traded inside the $28,000-30,000 range for almost a month before entering a decisive breakdown stage.
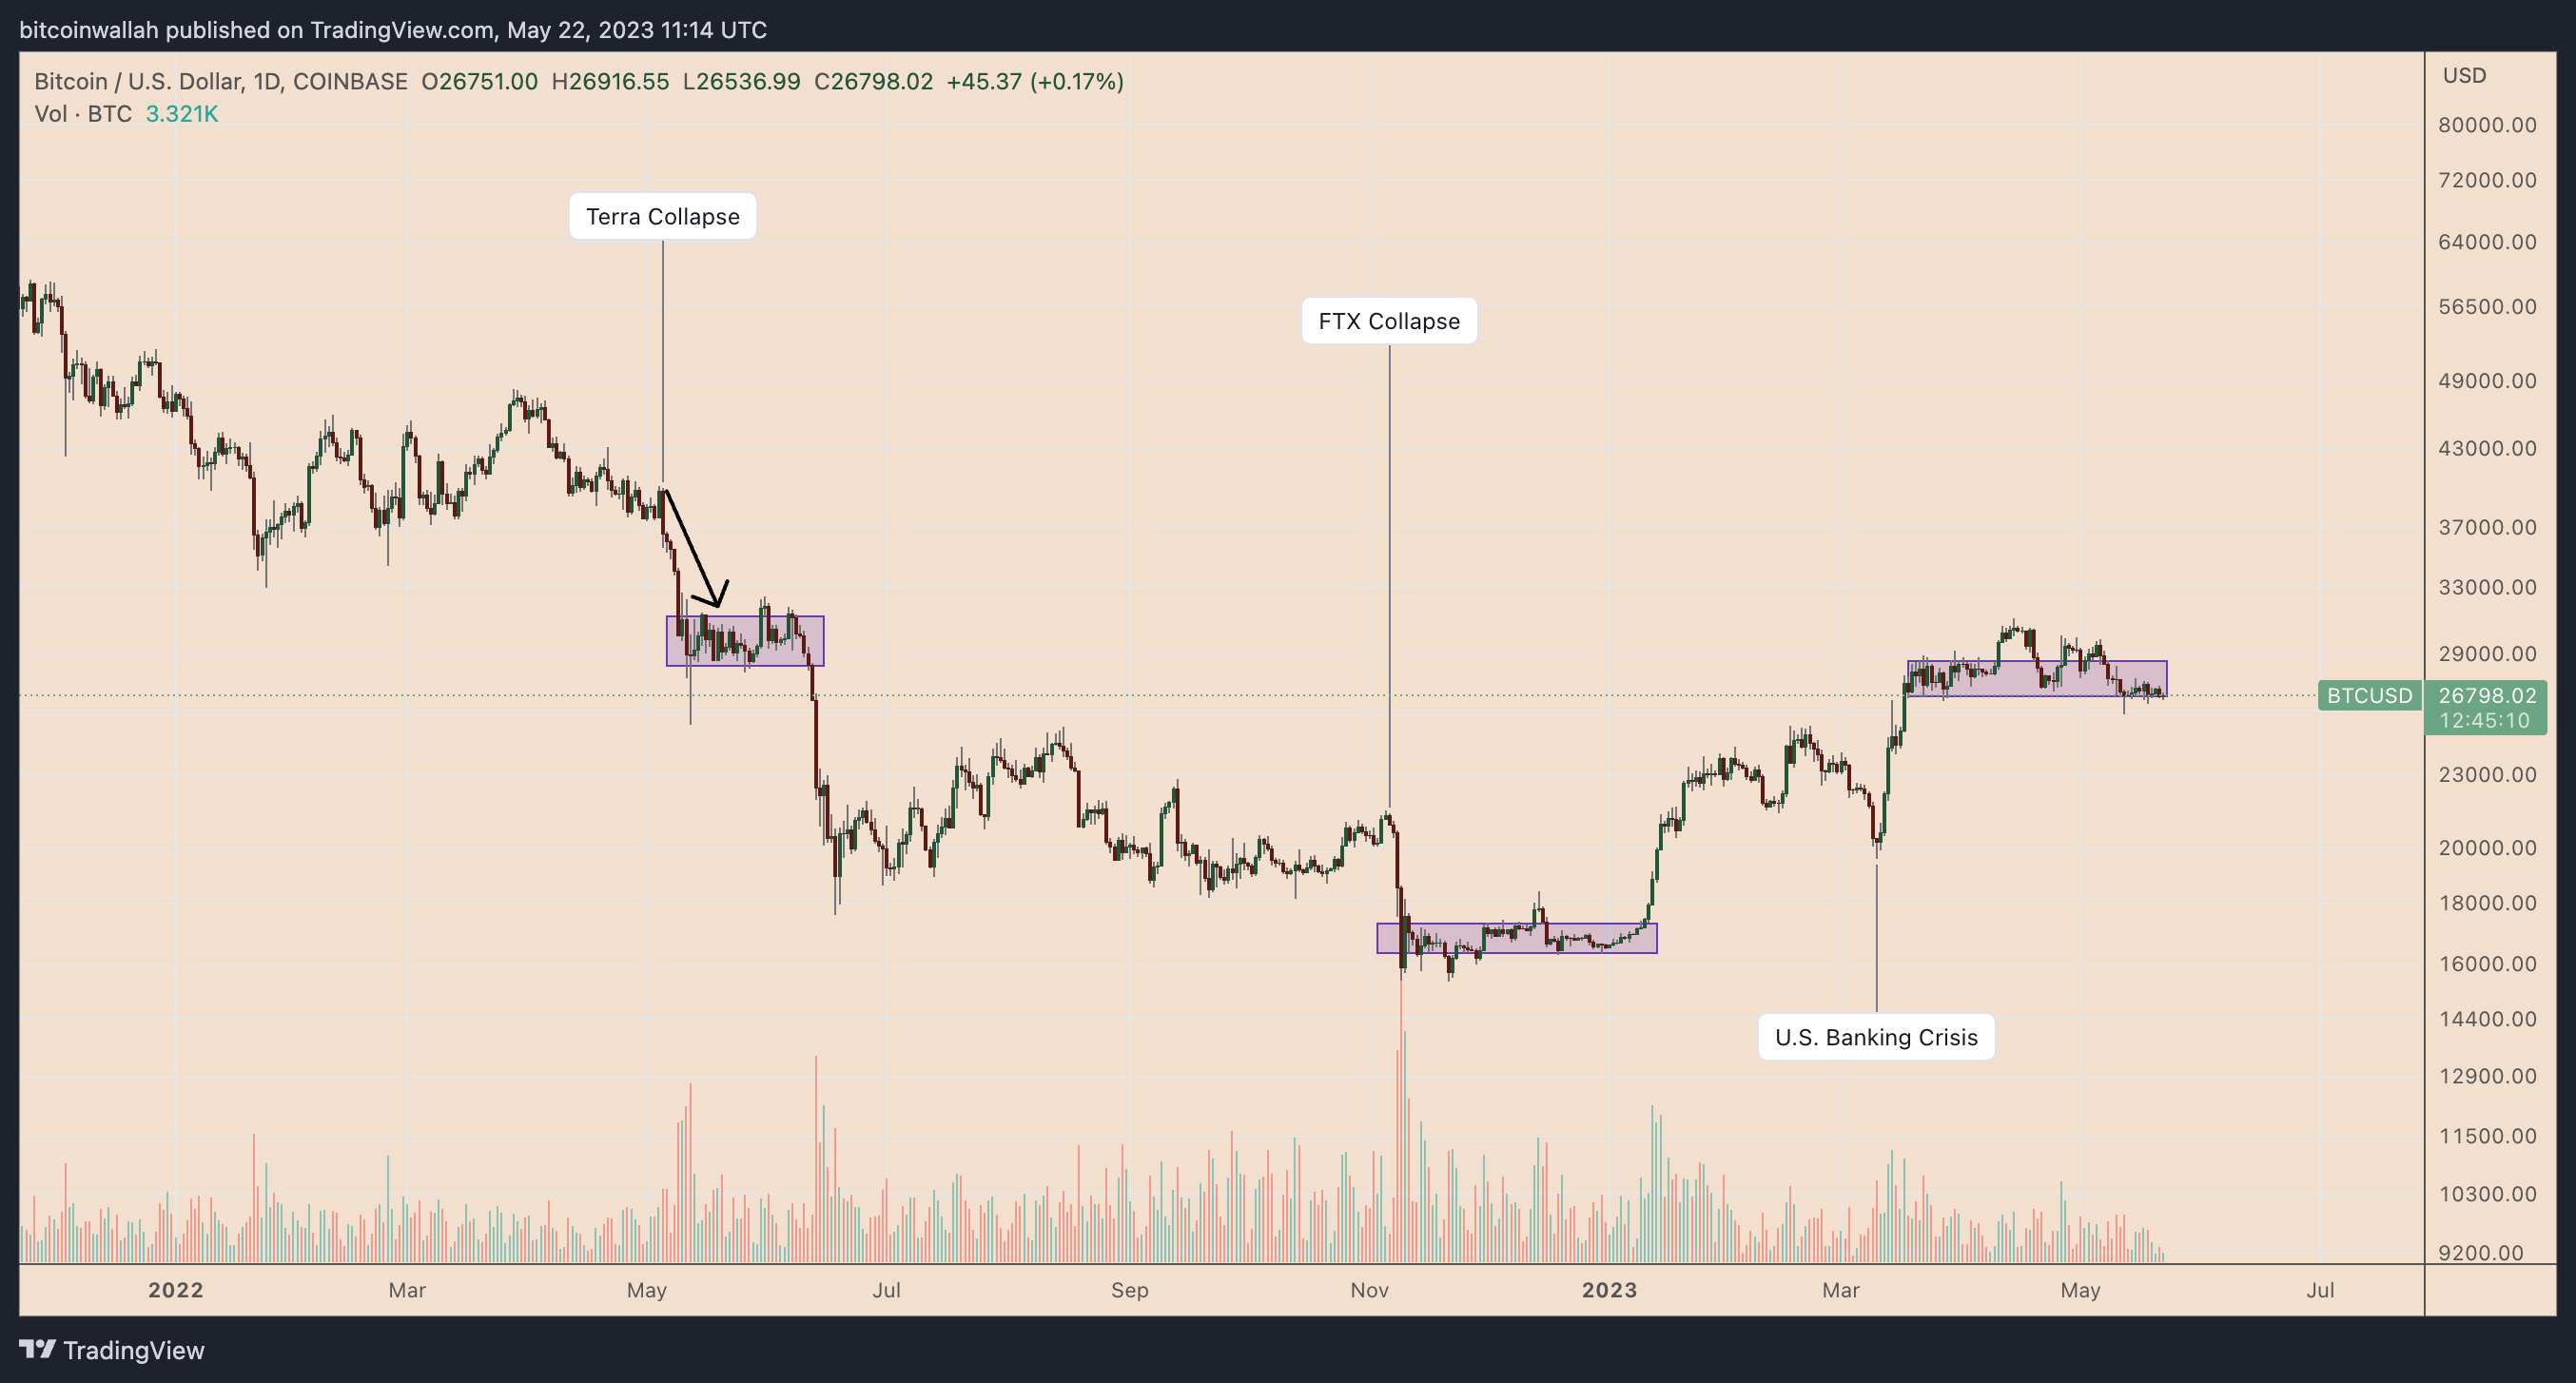
Bitcoin’s flat trajectory in May 2023 has followed the U.S. banking crisis rally two months ago with numerous failed attempts to cross above $30,000, a psychological resistance level.
In other words, Bitcoin traders are waiting for a potential market trigger once again that could decisively push BTC price in either direction.
Related: How do the Fed’s interest rates impact the crypto market?
One major potential event will be the Federal Reserve’s decision on interest rates next month.
Currently, the conflicting outlook on raising interest rates is likely the main factor behind the sideways action of the stocks, including risk assets and cryptocurrencies. In fact, BTC price has seen one of its least-volatile periods since April, historic volatility data shows.
What’s next for BTC price in the short term?
Technicals meanwhile show that a potential breakout above its 50-day exponential moving average (50-day EMA; the red wave) around $27,580 is in play.
If this happens, BTC price may once again retest the important $30,000-resistance level, where a rejection will be highly-probable upon first attempt.
Conversely, a pullback from the 50-day EMA would put BTC price en route toward the next big support level for a potential bounce at its 200-day EMA (the blue wave) near $25,000.
This article does not contain investment advice or recommendations. Every investment and trading move involves risk, and readers should conduct their own research when making a decision.
Source link

Bitcoin (BTC) is entering a new “speculation cycle” typical of a bull run, new analysis says.
In a tweet on May 16, Philip Swift, creator of data resource LookIntoBitcoin and co-founder of trading suite Decentrader, revealed history repeating itself according to the RHODL Ratio metric.
RHODL Ratiocreator on BTC price: “Zoom out”
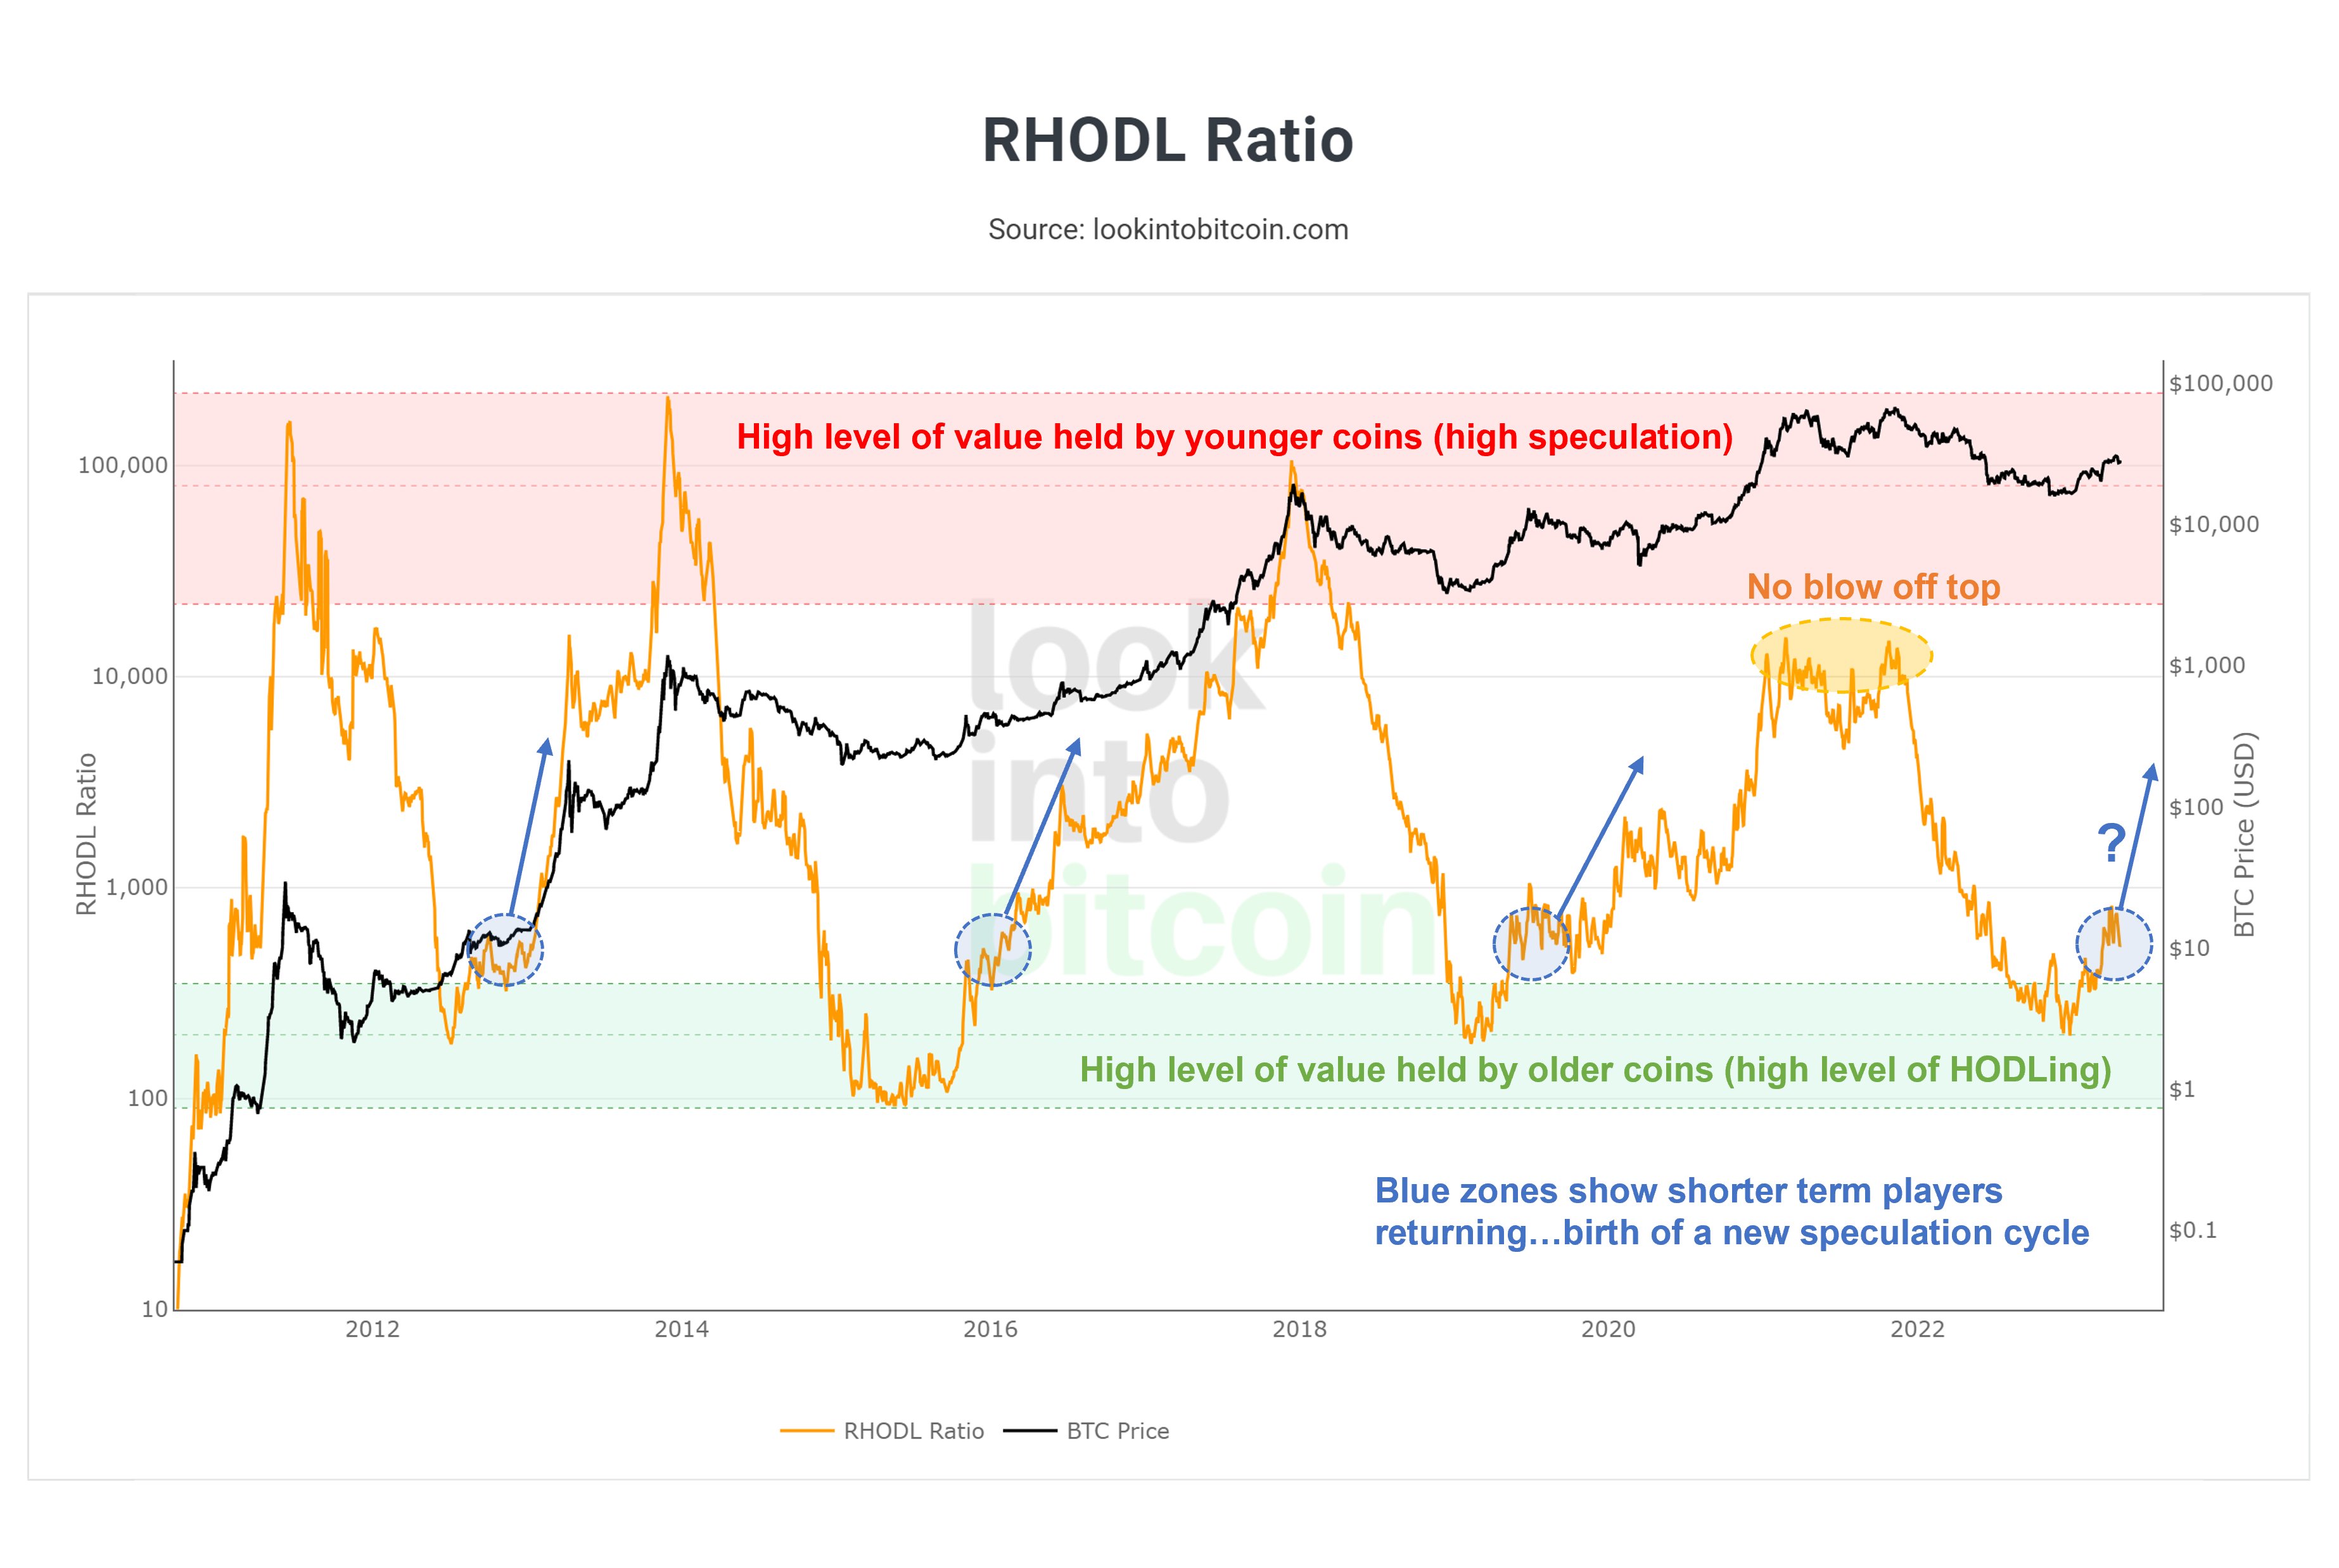
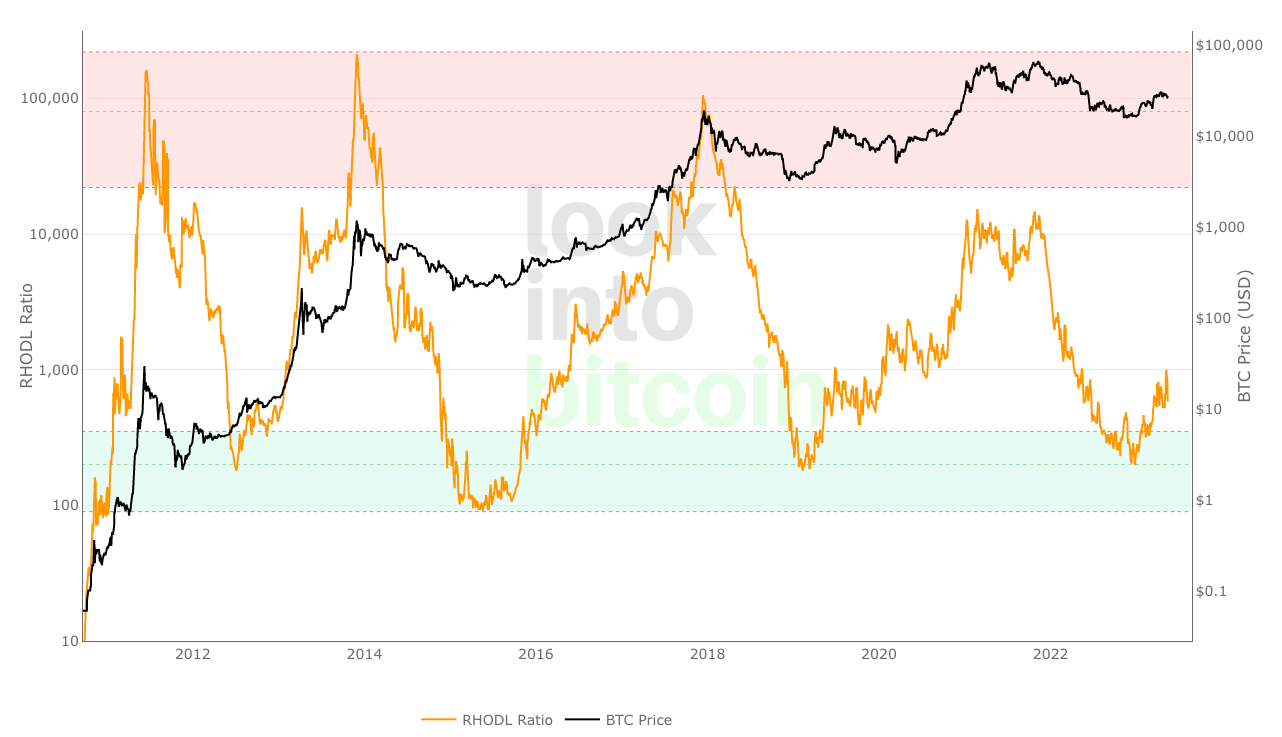
RHODL Ratio is a method of tracking BTC price behavior based on the realized price of the supply — the price at which coins last moved.
Created by Swift in 2020, it compares the relative ages of coins which moved one week ago to those which moved 1-2 years ago.
This ratio gives an insight into the relative activity of short-term (STHs) and long-term holders (LTHs), and by extension the extent to which speculation is present on the market.
Currently, RHODL is bouncing higher, having hit its green accumulation zone at the end of 2022.
At the time, Swift told Cointelegraph that Bitcoin was “at the point of maximum opportunity” — something which has since proven true, with BTC/USD gaining 70% in Q1 2023.
Prior to that, its descent toward that point had coincided with Bitcoin’s own retreat to macro lows.
Now, with speculative activity seemingly increasing, he believes that a new bull cycle is already underway.
“When I created the bitcoin RHODL Ratio indicator in 2020, one thing that struck me was how it showed a new bull run forming…when the ratio value of younger coins began to increase. Which is where we are right now,” he commented.
“Don’t panic about small price pullbacks. Zoom out.”
Swift is not alone in his conviction. Responding, Checkmate, lead on-chain analyst at Glassnode, called RHODL Ratio “one of the greatest onchain finds.”
An accompanying chart meanwhile added that the 2021 bull market, despite delivering a blow-off top for BTC/USD, did not see a copycat move for RHODL. The last time the metric hit its red “high speculation” zone was at Bitcoin’s prior all-time high in late 2017.
Fear, depression and lack of interest
Continuing, Swift argued that on short timeframes, market participants remain risk-off on crypto markets.
Related: Watch these BTC price levels as Bitcoin threatens to lose $27K support
The conclusion followed a scan of funding rates on exchanges, with a slew of “bearish” ratings for Bitcoin generated by Decentrader. These concerned open interest and long/short ratio in addition to funding rates themselves.
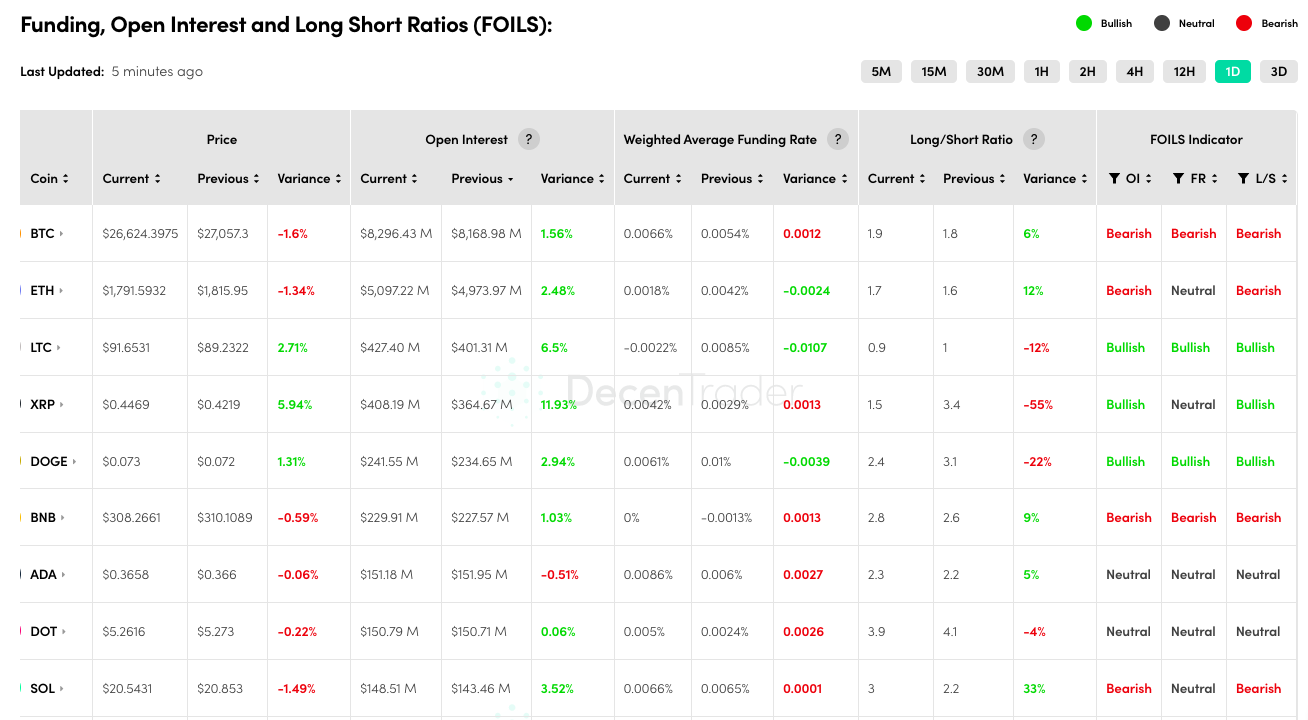
“Market is still fearful/depressed/uninterested…” he summarized on the day.
Earlier this month, Swift gave Cointelegraph an updated forecast on what might happen to Bitcoin in the final year before its next block subsidy halving. Among other eventualities, a return to $20,000 is not out of the question.
Magazine: Alameda’s $38B IRS bill, Do Kwon kicked in the assets, Milady frenzy: Asia Express
This article does not contain investment advice or recommendations. Every investment and trading move involves risk, and readers should conduct their own research when making a decision.
Source link
analysis
Bitcoin’s dive under $27K liquidates $100M — So why aren’t margin traders flipping bearish?

Bitcoin’s price (BTC) broke below its 55-day support at $27,000 on May 12. In result, the two-day, 7% correction to $26,155 caused $100 million worth of long BTC futures contracts to be liquidated.
However, Bitcoin margin and futures markets displayed strength during the down-move, fueling hope of a recovery toward $28,000.
Regulatory pressure, stronger U.S. dollar bite
Regulatory uncertainty in the United States significantly increased after Bitcoin miner Marathon Digital received yet another subpoena. The publicly traded mining company informed investors on May 10 that it received a subpoena from the U.S. Securities and Exchange Commission (SEC) concerning whether it may have violated federal securities laws, among other things, by using related-party transactions.
Furthermore, there’s the additional risk of the 627,522 Bitcoins held by the Grayscale GBTC Trust Fund, which has been trading at a steep discount for over a year while Grayscale’s holding company, Digital Currency Group (DCG), struggles with some failing subsidiaries. DCG’s crypto lending and trading firm, Genesis Capital, filed for Chapter 11 bankruptcy protection in January.
Despite having separate corporate structures, Genesis Capital had “intercompany obligations” with the holding company DCG, so the consequences for the administration of the Grayscale funds are unknown. Additionally, the group reportedly owes Gemini’s clients about $900 million, and the U.S. SEC charged Genesis and Gemini in January.
Bitcoin’s 7.2% correction happened as the dollar strength index (DXY), which measures the U.S. currency against a basket of foreign exchanges, displayed strength. The indicator reached 101 on May 8, nearing its 12-month low, a sign of low-confidence in the government’s ability to curb inflation while simultaneously managing to increase the debt limit.
Historically, there has been an inverse correlation between the DXY index and risk-on assets such as Bitcoin, given that a weaker dollar tends to drive demand for alternative store-of-values and scarce assets.
Let’s look at derivatives metrics to better understand how professional traders are positioned in the current market environment.
Bitcoin margin market traders slightly less optimistic
Margin markets provide insight into how professional traders are positioned because they allow investors to borrow cryptocurrency to leverage their positions.
OKX, for instance, provides a margin lending indicator based on the stablecoin/BTC ratio. Traders can increase their exposure by borrowing stablecoins to buy Bitcoin. On the other hand, Bitcoin borrowers can only bet on the decline of the cryptocurrency’s price.
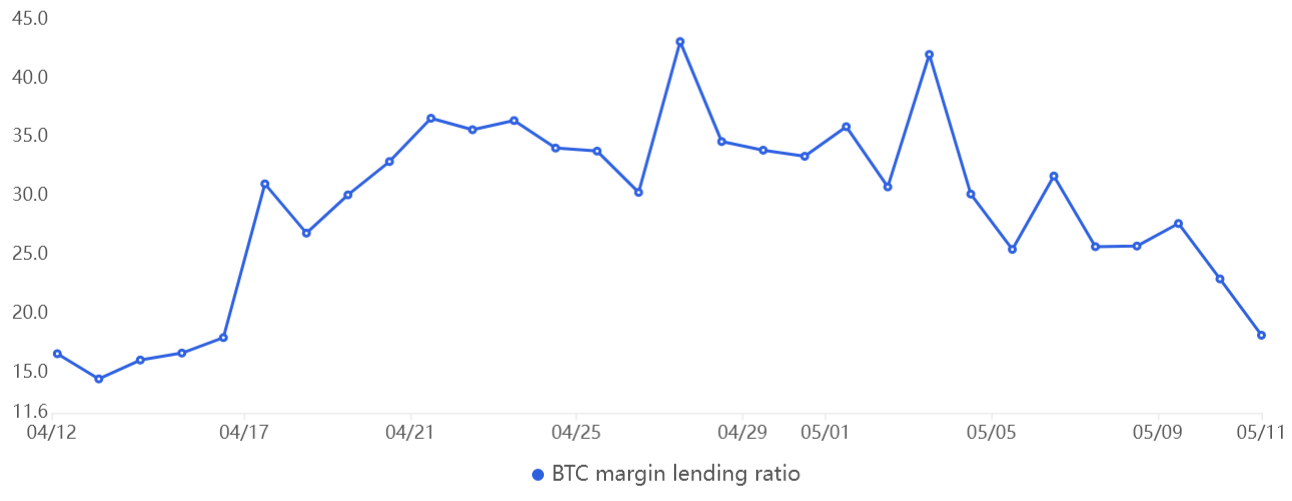
The above chart shows that OKX traders’ margin lending ratio decreased between May 8 and May 11. Still, that is not concerning, given that those traders remain favoring bullish strategies as the stablecoin (long) demand currently surpasses the BTC (short) demand by a factor of 18 times — which is healthy.
Related: Texas votes to add crypto to state’s Bill of Rights
No signs of panic selling after Bitcoin price crash
To exclude externalities that might have solely impacted the margin markets, traders should analyze the long-to-short metric. The metric gathers data from exchange clients’ positions on spot, perpetual, and quarterly futures contracts, thus offering better information on how pro traders are positioned.
There are occasional methodological discrepancies between different exchanges, so readers should monitor changes instead of absolute figures.
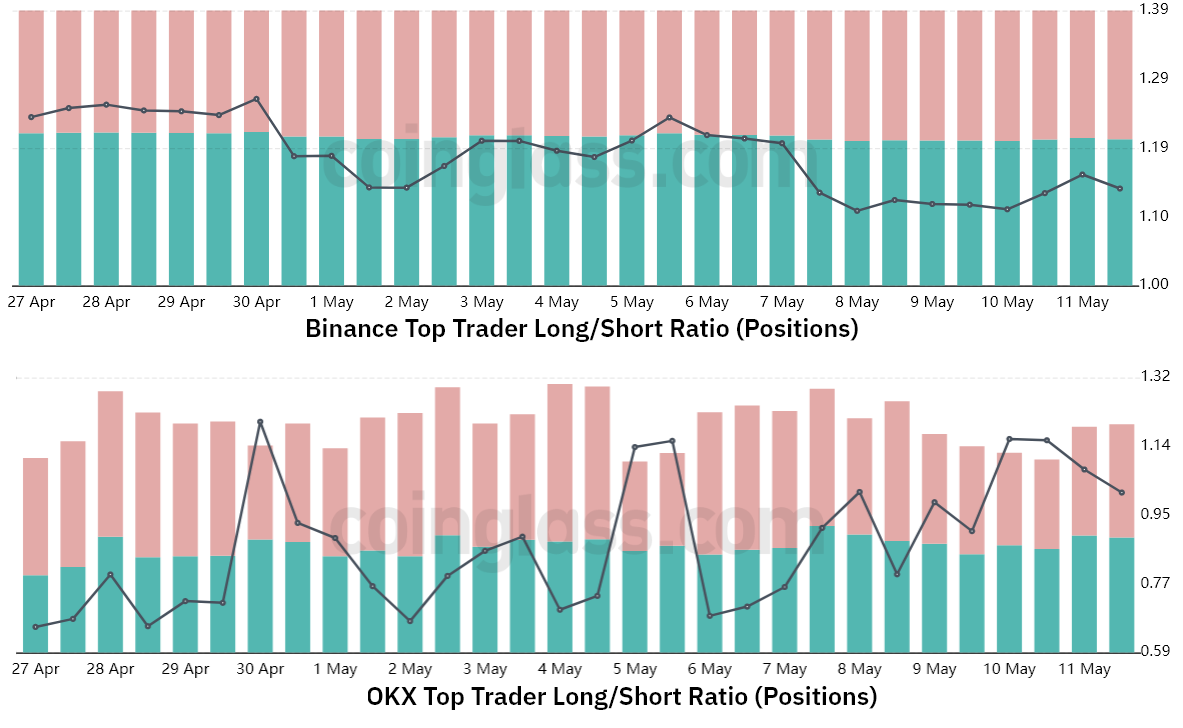
Even though Bitcoin broke below the $28,000 support, professional traders have increased their leveraged long positions using futures, according to the long-to-short indicator.
At crypto exchange OKX, the long-to-short ratio increased, from 0.92 on May 8 to 1.01 on May 12. Meanwhile, at Binance, the long-to-short ratio stabilized at 1.13, indicating there was no shift to a bearish position from whales and market makers.
Therefore, despite the 12% price decline from a high of $29,865 on May 6, traders using margin and futures contracts did not abandon their bullish stance. The movement indicates confidence that Bitcoin is more likely to reclaim $28,000 than succumb to the next support level near $24,500.
This article is for general information purposes and is not intended to be and should not be taken as legal or investment advice. The views, thoughts, and opinions expressed here are the author’s alone and do not necessarily reflect or represent the views and opinions of Cointelegraph.
Source link

Crypto payments platform Wyre shutters citing bear market conditions

Assessing Ripple-Colombia Central Bank Partnership

Nike teases upcoming ‘Airphoria’ NFT sneaker hunt on Fortnite

Bitcoin Market Dominance Peaks In Nearly Two Years, Here’s Why

Ethereum network upgrade and uptick in Arbitrum active users could trigger an ARB price reversal

XRP Allegedly Attacked By SEC’s Hinman For Ethereum’s Benefit

On-chain sleuth ZachXBT sued for libel after claiming plaintiff drained funds from project

Percentage Of ETH Addresses In Profit Reaches 5-Month Low

Think AI tools aren’t harvesting your data? Guess again

Bitcoin Bullish Momentum Building: Expert Predicts Rise To $27,200

Which altcoins will survive the SEC crackdown? Bitcoin OG explains

Curve (CRV) Observes 7% Bounce As Short Squeeze Occurs

Bakkt follows Robinhood, eToro in delisting major altcoins: Report

Shiba Inu Lead Developer Unveils Shibacals, Advancing Shibarium Development

dApp Store kit adopts new tech stack to power Web3 gaming development

Judge rules LBRY video platform’s token is a security in case brought by the US SEC

Will the Bitcoin mining industry collapse? Analysts explain why crisis is really opportunity

Silvergate Capital’s crypto-to-fiat transfers decrease by $50B compared to Q3 2021

Exchange Outflows Shows Bitcoin, Ethereum Accumulation Trend Continues

Bitcoin Dropped Below 2017 All-Time-High but Could Sellers be Getting Exhausted? – Blockchain News, Opinion, TV and Jobs
BNM DAO Token Airdrop

What does the Coinbase Premium Gap Tell us about Investor Activity? – Blockchain News, Opinion, TV and Jobs
Fed policy and crumbling market sentiment could send the total crypto market cap back under $1T
New Minting Services

Can Cardano’s July hard fork prevent ADA price from plunging 60%?

Friends or Enemies? – Blockchain News, Opinion, TV and Jobs

SEC’s Chairman Gensler Takes Aggressive Stance on Tokens – Blockchain News, Opinion, TV and Jobs

LUNA2 Recovers 70% In Nine Days From Historic Lows

Enjoy frictionless crypto purchases with Apple Pay and Google Pay | by Jim | @blockchain | Jun, 2022
A String of 200 ‘Sleeping Bitcoins’ From 2010 Worth $4.27 Million Moved on Friday
-
 SEC7 months ago
Judge rules LBRY video platform’s token is a security in case brought by the US SEC
-
 Antminer11 months ago
Will the Bitcoin mining industry collapse? Analysts explain why crisis is really opportunity
-
 Banking8 months ago
Silvergate Capital’s crypto-to-fiat transfers decrease by $50B compared to Q3 2021
-
 Bitcoin8 months ago
Exchange Outflows Shows Bitcoin, Ethereum Accumulation Trend Continues
-
 Altcoins12 months ago
Bitcoin Dropped Below 2017 All-Time-High but Could Sellers be Getting Exhausted? – Blockchain News, Opinion, TV and Jobs
-
Uncategorized1 year ago
BNM DAO Token Airdrop
-
 Binance11 months ago
What does the Coinbase Premium Gap Tell us about Investor Activity? – Blockchain News, Opinion, TV and Jobs
-
 Asia11 months ago
Fed policy and crumbling market sentiment could send the total crypto market cap back under $1T