
ETH
Percentage Of ETH Addresses In Profit Reaches 5-Month Low

The brutal bear market in crypto over the past few months has taken a serious toll on ETH’s price and profitability. The price of Ethereum has been stuck in a sideways range recently, and many ETH holders have been unlucky for it. According to data from Glassnode, the percentage of Ethereum addresses in profit has now dropped to a 5-month low.
Percentage Of Addresses In The Green Drops To 55.414%
Back in 2021, when the price of ETH was at its highest, the majority of addresses held a comfortable position. Now, two years later, for new investors who bought at higher prices, the wait for their positions to go green again has been a long one.
Glassnode, a crypto analytics platform, reports that the percentage of Ethereum addresses in green while measuring over a 7-day moving average is now at a 5-month low of 55.414%.
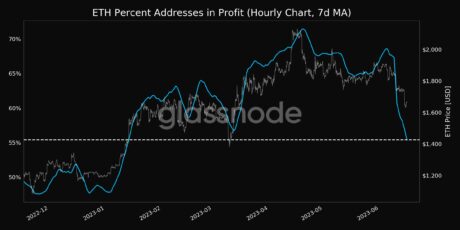
Percentage of addresses in profit drop to five-month low | Source: Glassnode on Twitter
This indicates that more than 44 percent of the people who own ETH are currently at a loss. In the same vein, the number of profitable addresses has dropped to its lowest point since March of this year, standing at 56,311,171.899 at the moment.
Moving ETH Off Exchanges
The amount of ETH held on cryptocurrency exchanges has also dropped to its lowest level in over 5 years. This means less ETH is available for trading on exchanges, which can impact the price and liquidity. Traders are withdrawing their ETH from exchanges and holding it in private digital wallets.
The drop can also be linked to an all-time high level of staking in the ETH 2.0 deposit contract. Data shows that the majority of ETH held by large investors are now moving ETH into the contract, showing that interest in ETH staking is growing. This declining supply, coupled with increasing mainstream interest in ETH, could drive the price higher if demand remains strong.
Ethereum Plunges Below $1,700
Meanwhile, Ethereum broke below critical price support earlier this week. The price plunged below $1,700 to $1,630 yesterday, marking its lowest value since March 16. The plunge in price and profitability is largely attributed to negative sentiment around rising inflation fears and the overall weakness in the crypto market recently.
ETH has since then recovered and is now trading at $1,720, looking to retest the $1,800 resistance once more. Of course, if $1,700 fails to hold, Ethereum could fall further to test support at $1,400 or even $1,300. A drop below $1,700 again would be very bearish and see the profitability percentage drop further.
Ethereum price recovers above $1,700 | Source: ETHUSD on TradingView.com
Featured image from The Cryptoknowmist, chart from TradingView.com
Source link


Ethereum price is still struggling below $1,720 against the US Dollar. ETH could continue to move down if it stays below $1,700 and $1,720.
- Ethereum is slowly moving higher from the $1,620 support zone.
- The price is trading below $1,700 and the 100-hourly Simple Moving Average.
- There is a key bearish trend line forming with resistance near $1,720 on the hourly chart of ETH/USD (data feed via Kraken).
- The pair could struggle to recover above the $1,700 and $1,720 resistance levels.
Ethereum Price Faces Uphill Task
Ethereum’s price remained in a bearish zone below the $1,720 resistance. ETH extended its decline below the $1,660 level, similar to Bitcoin.
There was a spike below the $1,630 support. The price tested the $1,620 zone. A low is formed near $1,620 and the price is now attempting a recovery wave. There was a move above the $1,640 and $1,650 levels. The bulls pushed the price toward the 50% Fib retracement level of the downward move from the $1,748 swing high to the $1,620 low.
Ether is still trading below $1,700 and the 100-hourly Simple Moving Average. There is also a key bearish trend line forming with resistance near $1,720 on the hourly chart of ETH/USD.
Immediate resistance is near the $1,700 level or the 100-hourly Simple Moving Average. It is close to the 61.8% Fib retracement level of the downward move from the $1,748 swing high to the $1,620 low. The next major resistance is near the $1,720 level and the trend line.
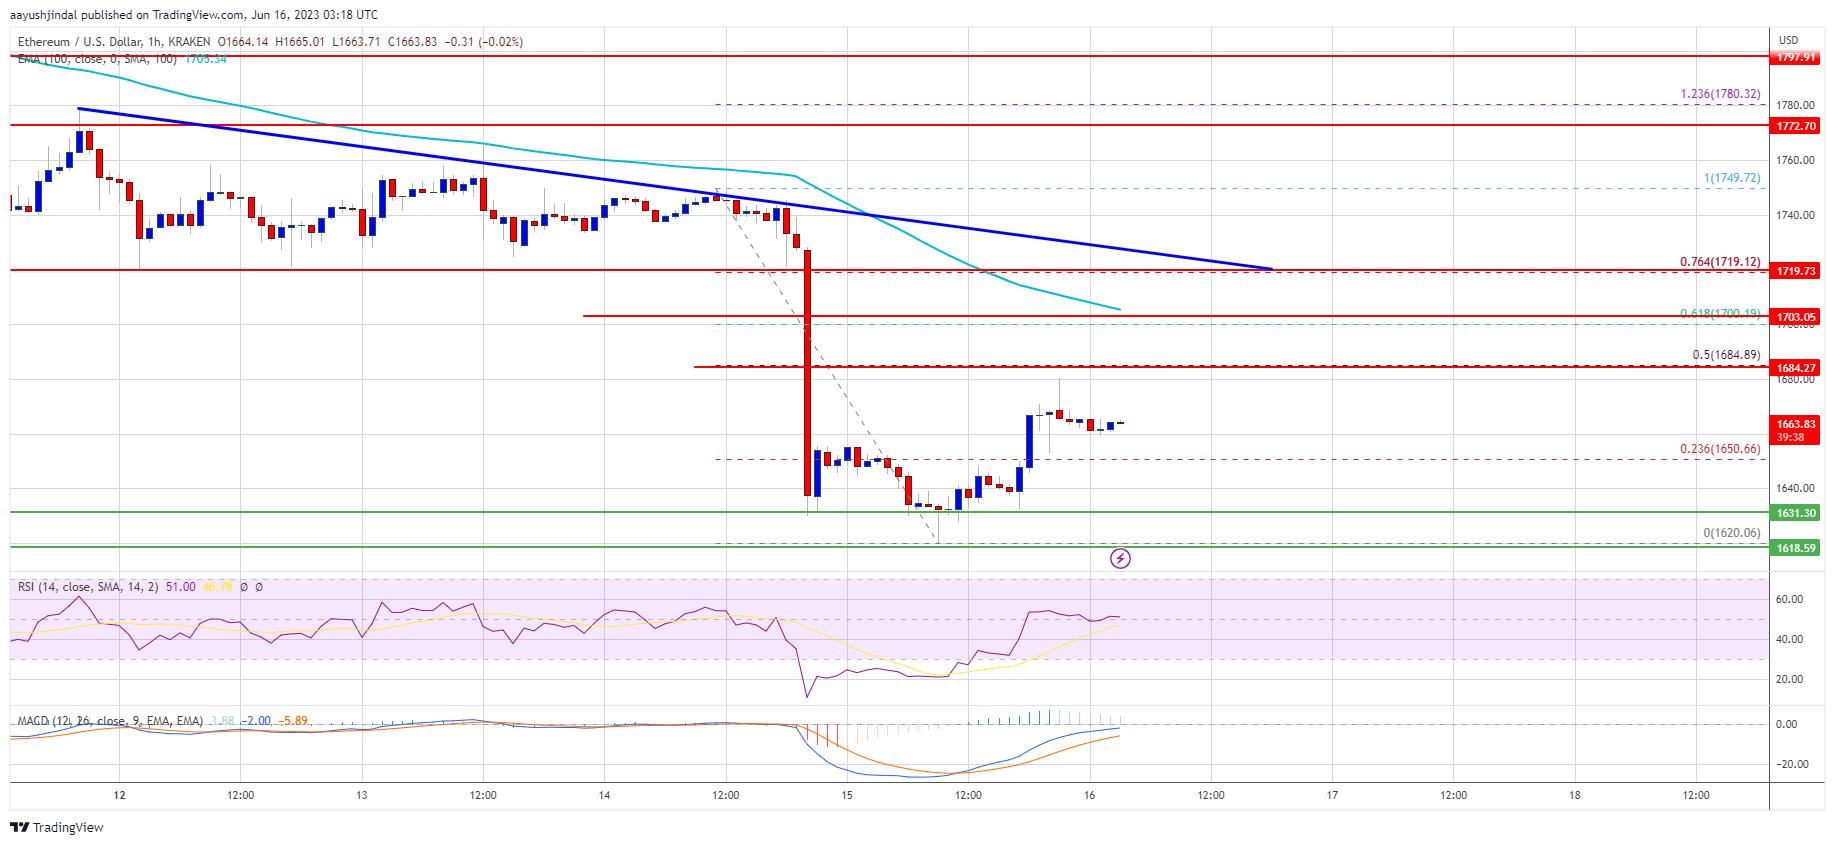
Source: ETHUSD on TradingView.com
A proper move above the $1,700 and $1,720 resistance levels might start a steady recovery wave. The next resistance sits near $1,775, above which Ethereum could rise toward the $1,820 level. Any more gains above the $1,820 resistance zone might send the price toward the $1,850 resistance.
Fresh Decline in ETH?
If Ethereum fails to clear the $1,700 resistance, it could start another decline. Initial support on the downside is near the $1,640 level.
The next major support is near the $1,620 level. If there is a break and close below the $1,620 support, the price could dive toward the $1,550 support. Any more losses may perhaps send the price toward the $1,500 zone.
Technical Indicators
Hourly MACD – The MACD for ETH/USD is losing momentum in the bearish zone.
Hourly RSI – The RSI for ETH/USD is now above the 50 level.
Major Support Level – $1,620
Major Resistance Level – $1,700
Source link

Ethereum has plunged below $1,700 during the past day. Here’s the on-chain indicator that may have signaled this dip in advance.
Ethereum Age Consumed Metric Saw A Spike Before The Price Decline
According to data from the on-chain analytics firm Santiment, institutional investors look to have been expecting the move to take place. The indicator of interest here is the “ETH age consumed,” which first finds the total number of coins moving on the Ethereum blockchain. Then it multiplies this value by the days these coins had been dormant before their movement.
So, in this way, the metric keeps track of how many coins are being sold/moved each day and uses their age as a weighting factor. This means that many old coins are moved to the network whenever this indicator’s value is high.
Naturally, low values of the metric, on the other hand, would imply that there aren’t many coins moving on the chain right now or some coins with a low average age are being transferred.
Now, here is a chart that shows the trend in the Ethereum age consumed over the past month:
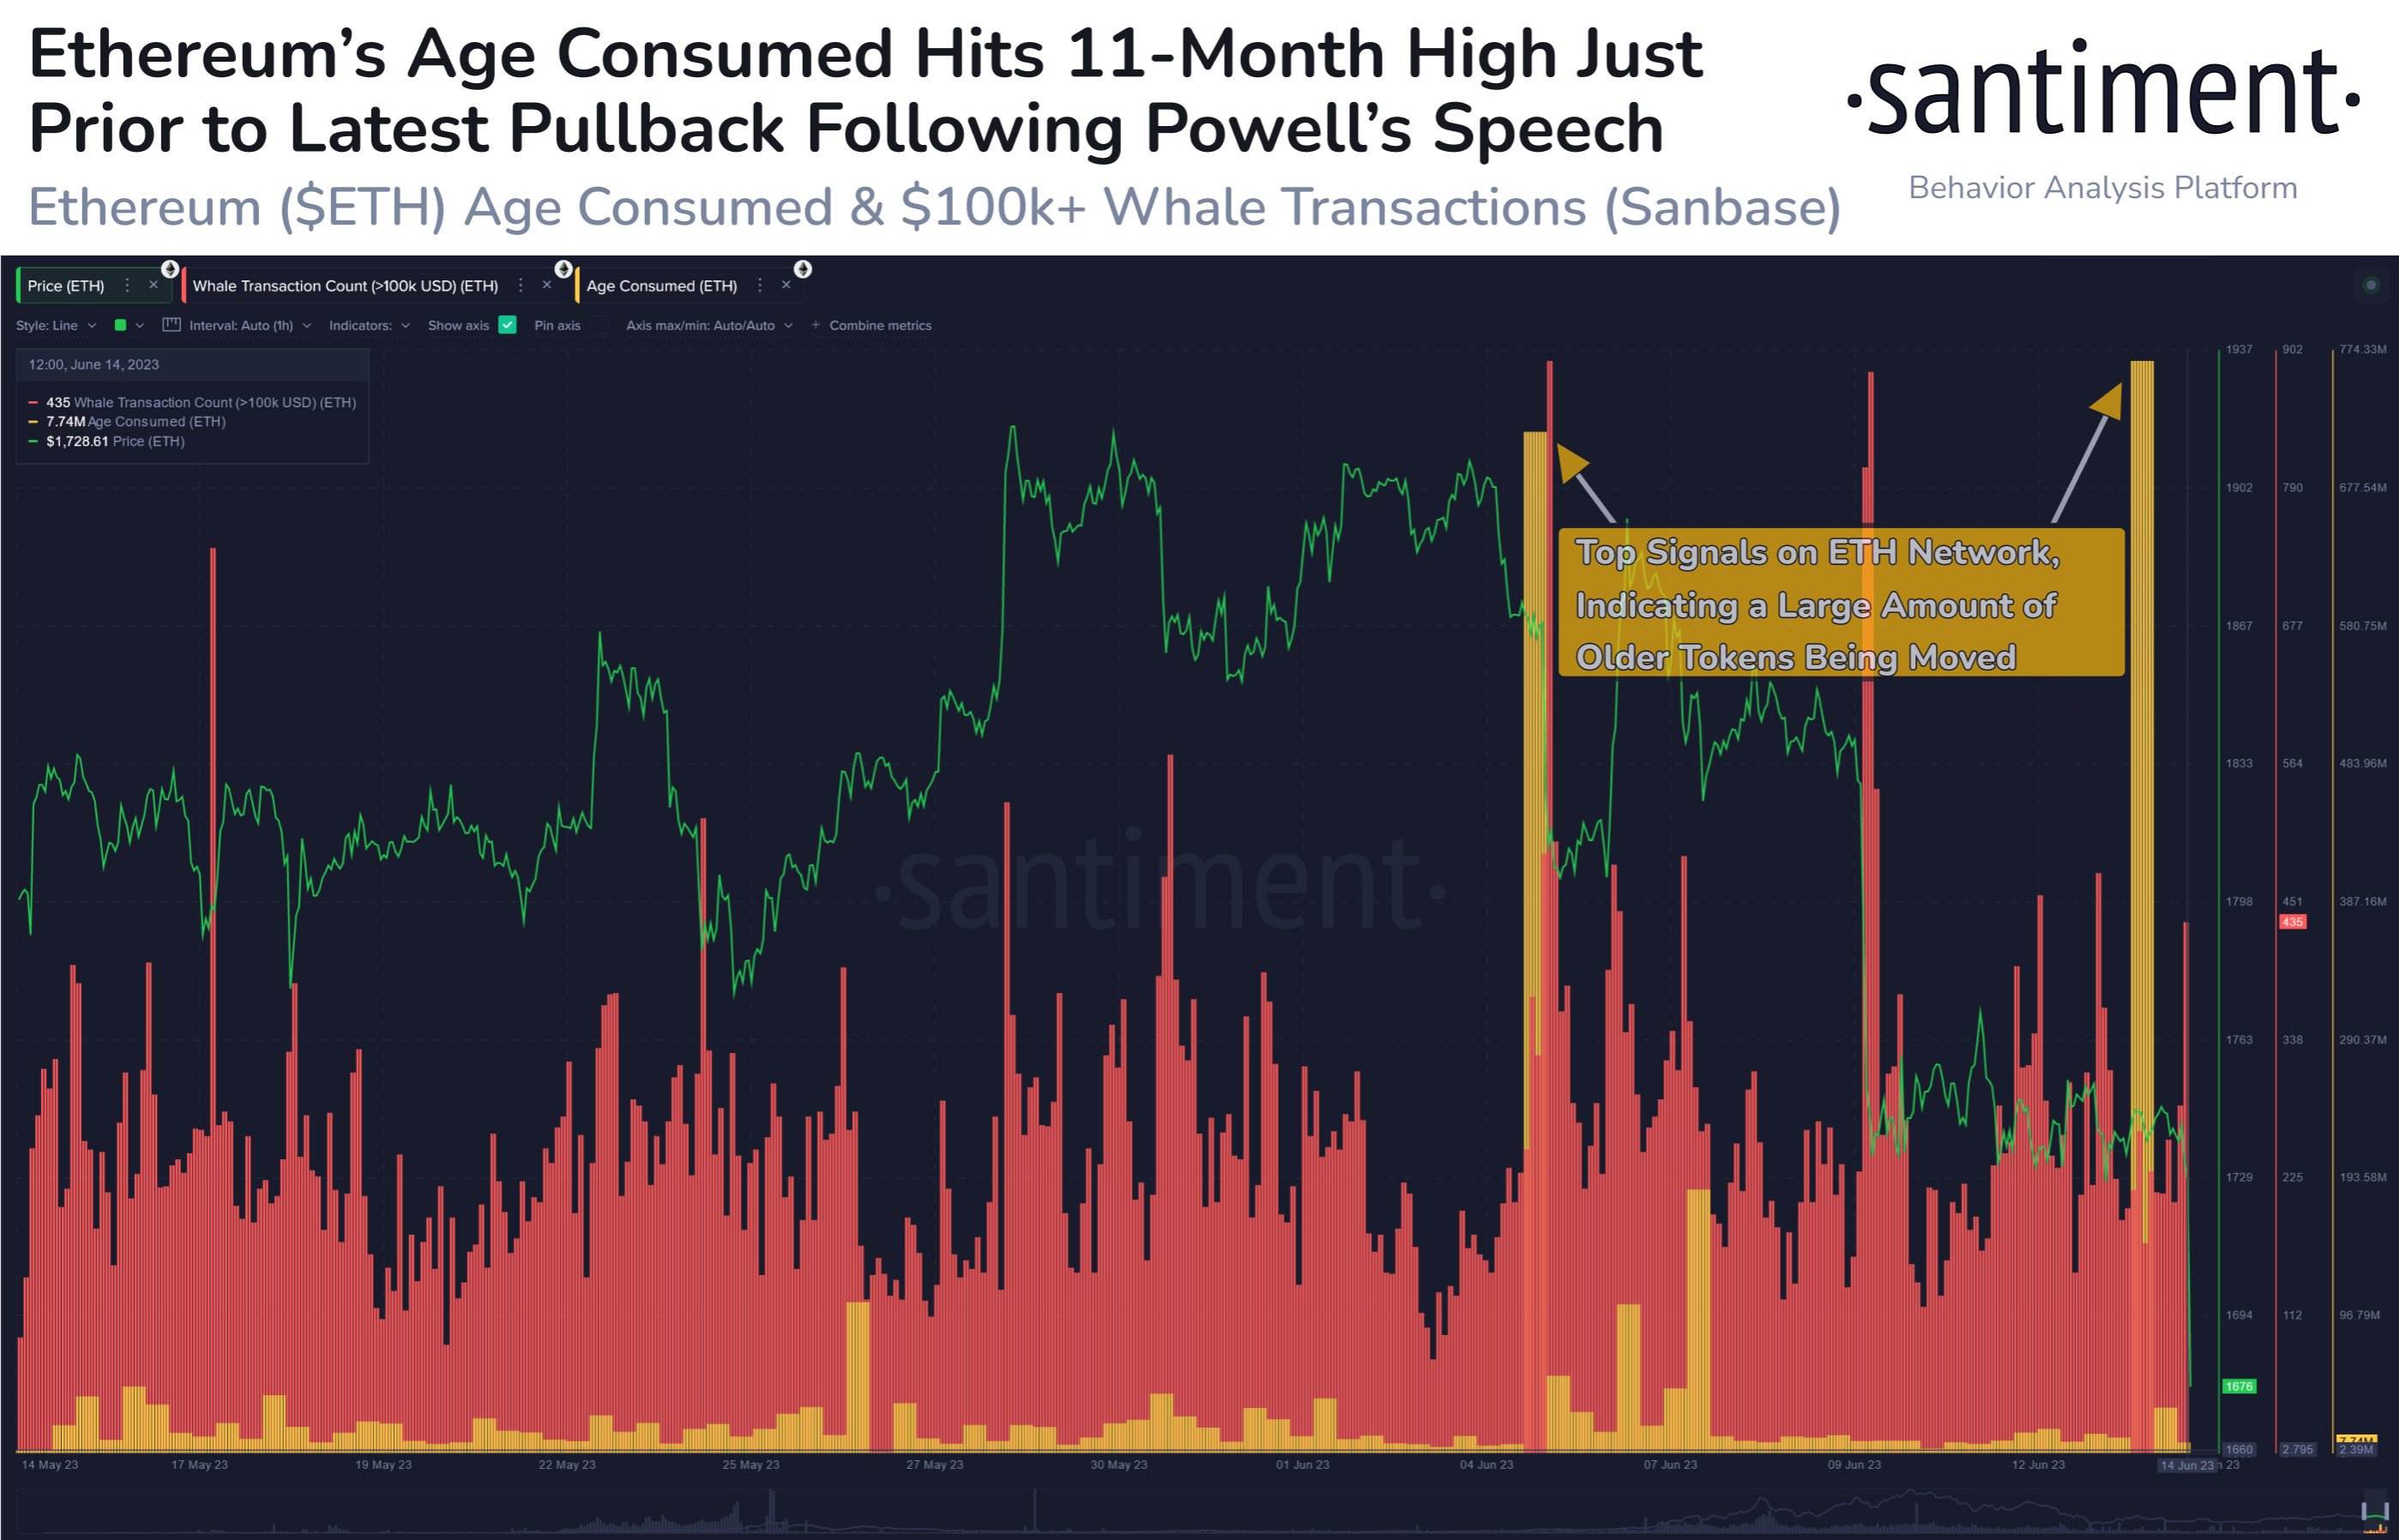
Looks like the value of the metric has been quite high in recent days | Source: Santiment on Twitter
As displayed in the above graph, the Ethereum age consumed metric had recently registered a very large spike. This would suggest the potential movement of many dormant coins on the chain during this surge.
Generally, when such large spikes in the indicator are observed, it’s a sign of selling from the long-term holders (LTHs). The LTH cohort includes all the investors holding onto their coins since more than 155 days ago.
These holders are the experienced hands in the market who don’t easily sell even when the market is distressed. Because of this reason, their movements can be something to watch out for, as when they do finally sell, it’s usually not a positive sign for the price.
The chart shows that the LTHs had also shown a large move earlier in the month. Shortly after these investors became active, the cryptocurrency price plunged.
This time, the spike in the Ethereum age consumed also seems to have preceded a price decline, as the cryptocurrency’s value has now dropped below the $1,700 level.
This latest price plunge has come after the news that the US Federal Reserve isn’t raising interest rates this time, but more hikes would be coming later in the year to fight inflation.
Santiment suggests that the spike in the age consumed metric before the price decline could imply that the institutions already expected the move, hence why they shifted their coins early.
ETH Price
At the time of writing, Ethereum is trading around $1,600, down 11% in the last week.
ETH has taken a plunge recently | Source: ETHUSD on TradingView
Featured image from iStock.com, charts from TradingView.com, Santiment.net
Source link

Data shows XRP and Ethereum are picking up social volume as investors have seemingly started to lose interest in Bitcoin.
Bitcoin Social Volume Shows Drop, Traders Shift Focus Towards XRP & Ethereum
According to data from the on-chain analytics firm Santiment, BTC’s social volume has decreased since its surge in March. The “social volume” here refers to a metric that tells us about the degree of discussion around a given cryptocurrency that social media users are participating in currently.
The indicator measures this in terms of the total number of text documents (that, is the posts on various social media platforms like Reddit, Telegram, and Twitter) that are making mentions of the asset in question.
Something to keep in mind is that the social volume doesn’t put any weight on the actual amount of discussion taking place inside any post; what this means is that even if a text document mentions the term several times, its contribution towards the metric’s value would still remain just one unit.
The benefit of this restriction is that it provides a better picture of the amount of talk that the coin is receiving from the general user. If the limitation didn’t exist, then a long, isolated post with a large number of references to the cryptocurrency could possibly skew the indicator on its own.
Now, here is a chart that shows the trend in the social volumes of Bitcoin, Ethereum, Binance Coin, XRP, Cardano, and Dogecoin over the past year:
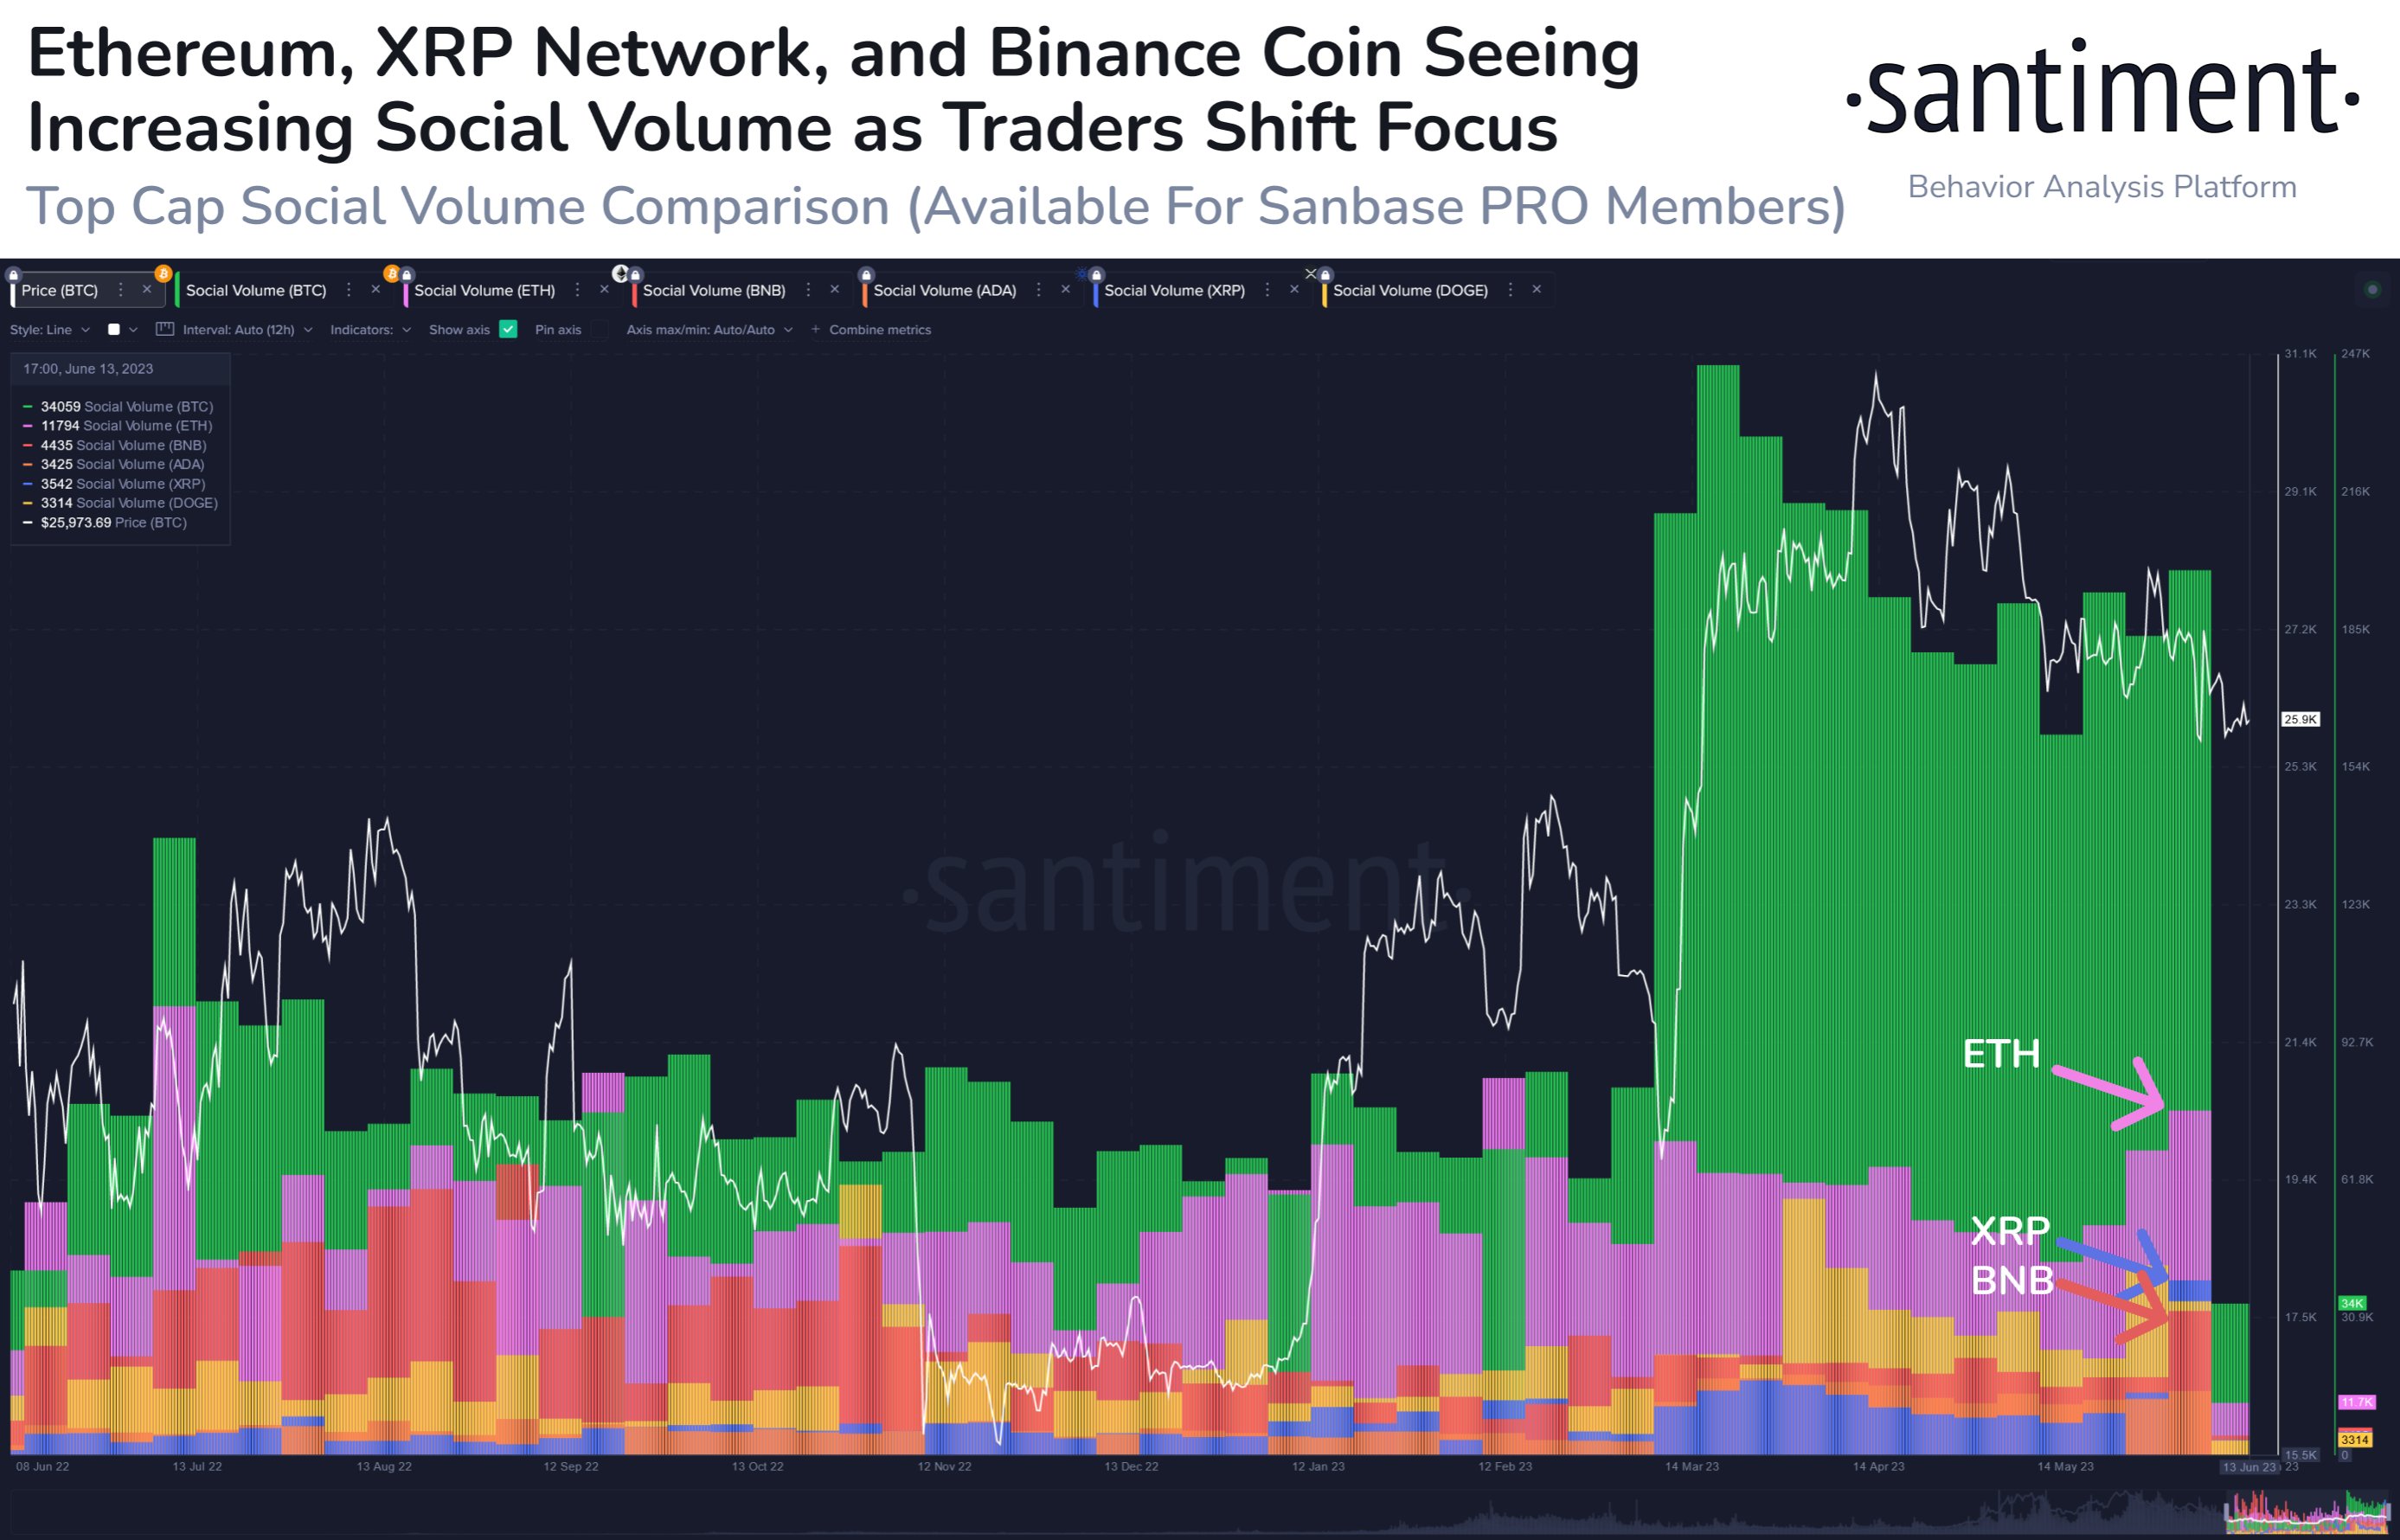
How the social volume of the various assets in the sector has changed in recent days | Source: Santiment on Twitter
As displayed in the above graph, the Bitcoin social volume observed a huge surge in March as the asset’s value first observed a hard plunge and then recovered with a spectacular rally.
Sharp price action like this always brings attention to any cryptocurrency, so it makes sense that social media users started participating in huge amounts of discussion around the coin.
Since topping out in April, however, the asset’s price has been in an overall downtrend. The social volume has also been going in a downward trajectory alongside it, although the indicator has observed a small rise during the recent volatile event.
The high volatility had come as the US SEC had sued Binance and Coinbase, back to back, leading to widespread panic in the market. As mentioned before, it’s not particularly uncommon to see the social volume jump during such rapid swings in price.
Ethereum, XRP, and Binance Coin also saw a spike in discussions related to them during this event, surpassing the levels they have seen during the last few months.
While the volatility obviously has a part to play in this rise, it’s also possible that the slowdown in discussions related to Bitcoin has also contributed to it. It would appear that investors have been gradually losing interest in BTC, and are now shifting their focus towards altcoins such as XRP.
XRP Price
At the time of writing, XRP is trading around $0.5, down 4% in the last week.
Looks like the asset has been moving sideways | Source: XRPUSD on TradingView
Featured image from Kanchanara on Unsplash.com, charts from TradingView.com, Santiment.net
Source link

Ethereum network upgrade and uptick in Arbitrum active users could trigger an ARB price reversal

XRP Allegedly Attacked By SEC’s Hinman For Ethereum’s Benefit

On-chain sleuth ZachXBT sued for libel after claiming plaintiff drained funds from project

Percentage Of ETH Addresses In Profit Reaches 5-Month Low

Think AI tools aren’t harvesting your data? Guess again

Bitcoin Bullish Momentum Building: Expert Predicts Rise To $27,200

Which altcoins will survive the SEC crackdown? Bitcoin OG explains

Curve (CRV) Observes 7% Bounce As Short Squeeze Occurs

Bakkt follows Robinhood, eToro in delisting major altcoins: Report

Shiba Inu Lead Developer Unveils Shibacals, Advancing Shibarium Development

dApp Store kit adopts new tech stack to power Web3 gaming development

Polygon Sees Surge In Whale Buying: Recovery In The Cards?

7 alternatives to ChatGPT

What Happens To Bitcoin Price If Spot ETF Is Approved?

SEC argues against Dentons’ motion to dismiss Terraform and Do Kwon’s lawsuit

Judge rules LBRY video platform’s token is a security in case brought by the US SEC

Will the Bitcoin mining industry collapse? Analysts explain why crisis is really opportunity

Silvergate Capital’s crypto-to-fiat transfers decrease by $50B compared to Q3 2021

Exchange Outflows Shows Bitcoin, Ethereum Accumulation Trend Continues

Bitcoin Dropped Below 2017 All-Time-High but Could Sellers be Getting Exhausted? – Blockchain News, Opinion, TV and Jobs
BNM DAO Token Airdrop

What does the Coinbase Premium Gap Tell us about Investor Activity? – Blockchain News, Opinion, TV and Jobs
Fed policy and crumbling market sentiment could send the total crypto market cap back under $1T
New Minting Services

Can Cardano’s July hard fork prevent ADA price from plunging 60%?

Friends or Enemies? – Blockchain News, Opinion, TV and Jobs

SEC’s Chairman Gensler Takes Aggressive Stance on Tokens – Blockchain News, Opinion, TV and Jobs

LUNA2 Recovers 70% In Nine Days From Historic Lows

Enjoy frictionless crypto purchases with Apple Pay and Google Pay | by Jim | @blockchain | Jun, 2022
A String of 200 ‘Sleeping Bitcoins’ From 2010 Worth $4.27 Million Moved on Friday
-
 SEC7 months ago
Judge rules LBRY video platform’s token is a security in case brought by the US SEC
-
 Antminer11 months ago
Will the Bitcoin mining industry collapse? Analysts explain why crisis is really opportunity
-
 Banking8 months ago
Silvergate Capital’s crypto-to-fiat transfers decrease by $50B compared to Q3 2021
-
 Bitcoin8 months ago
Exchange Outflows Shows Bitcoin, Ethereum Accumulation Trend Continues
-
 Altcoins12 months ago
Bitcoin Dropped Below 2017 All-Time-High but Could Sellers be Getting Exhausted? – Blockchain News, Opinion, TV and Jobs
-
Uncategorized1 year ago
BNM DAO Token Airdrop
-
 Binance11 months ago
What does the Coinbase Premium Gap Tell us about Investor Activity? – Blockchain News, Opinion, TV and Jobs
-
 Asia11 months ago
Fed policy and crumbling market sentiment could send the total crypto market cap back under $1T